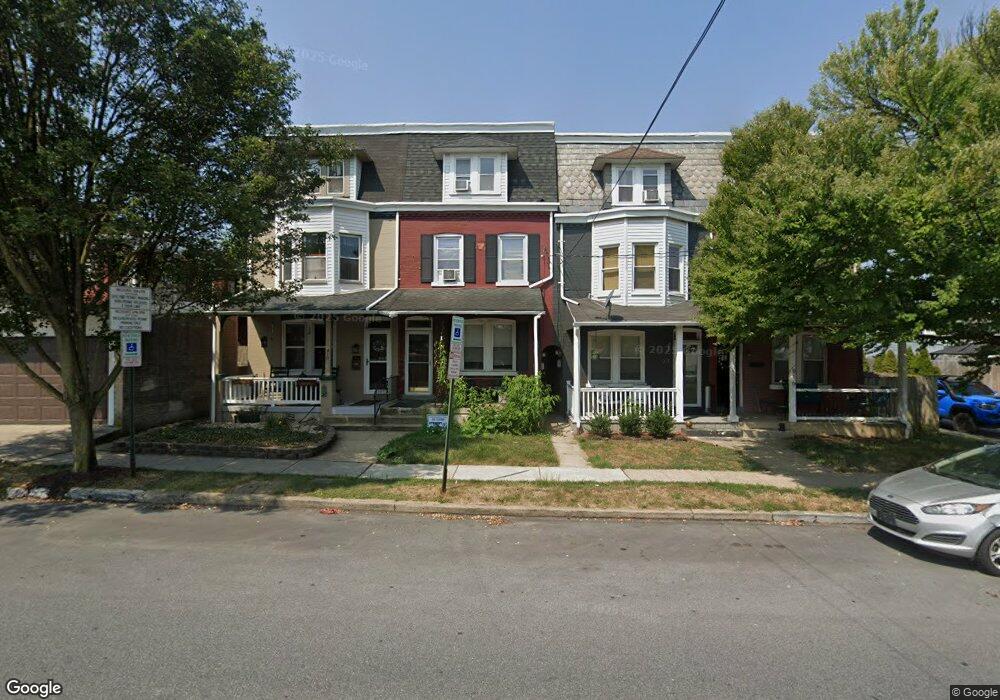
912 N Plum St Lancaster, PA 17602
Ross NeighborhoodEstimated Value: $247,000 - $269,000
4
Beds
1
Bath
1,573
Sq Ft
$165/Sq Ft
Est. Value
About This Home
This home is located at 912 N Plum St, Lancaster, PA 17602 and is currently estimated at $260,071, approximately $165 per square foot. 912 N Plum St is a home located in Lancaster County with nearby schools including Ross Elementary School, Lincoln Middle School, and McCaskey High School.
Ownership History
Date
Name
Owned For
Owner Type
Purchase Details
Closed on
Sep 28, 2009
Sold by
Gitomer Michael E and Gitomer Judith M
Bought by
Nesbitt Cory R and Nesbitt Andrea J
Current Estimated Value
Home Financials for this Owner
Home Financials are based on the most recent Mortgage that was taken out on this home.
Original Mortgage
$112,818
Outstanding Balance
$74,528
Interest Rate
5.31%
Mortgage Type
FHA
Estimated Equity
$185,543
Create a Home Valuation Report for This Property
The Home Valuation Report is an in-depth analysis detailing your home's value as well as a comparison with similar homes in the area
Home Values in the Area
Average Home Value in this Area
Purchase History
| Date | Buyer | Sale Price | Title Company |
|---|---|---|---|
| Nesbitt Cory R | $114,900 | None Available |
Source: Public Records
Mortgage History
| Date | Status | Borrower | Loan Amount |
|---|---|---|---|
| Open | Nesbitt Cory R | $112,818 |
Source: Public Records
Tax History Compared to Growth
Tax History
| Year | Tax Paid | Tax Assessment Tax Assessment Total Assessment is a certain percentage of the fair market value that is determined by local assessors to be the total taxable value of land and additions on the property. | Land | Improvement |
|---|---|---|---|---|
| 2025 | $3,838 | $97,000 | $17,800 | $79,200 |
| 2024 | $3,838 | $97,000 | $17,800 | $79,200 |
| 2023 | $3,774 | $97,000 | $17,800 | $79,200 |
| 2022 | $3,617 | $97,000 | $17,800 | $79,200 |
| 2021 | $3,539 | $97,000 | $17,800 | $79,200 |
| 2020 | $3,539 | $97,000 | $17,800 | $79,200 |
| 2019 | $3,486 | $97,000 | $17,800 | $79,200 |
| 2018 | $2,069 | $97,000 | $17,800 | $79,200 |
| 2017 | $3,472 | $75,600 | $15,500 | $60,100 |
| 2016 | $3,441 | $75,600 | $15,500 | $60,100 |
| 2015 | $1,342 | $75,600 | $15,500 | $60,100 |
| 2014 | $3,003 | $75,600 | $15,500 | $60,100 |
Source: Public Records
Map
Nearby Homes