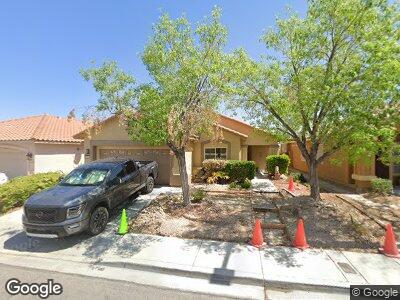
912 Royal Plum Ln Las Vegas, NV 89144
Summerlin NeighborhoodEstimated Value: $533,627 - $551,000
3
Beds
2
Baths
1,751
Sq Ft
$311/Sq Ft
Est. Value
About This Home
This home is located at 912 Royal Plum Ln, Las Vegas, NV 89144 and is currently estimated at $544,907, approximately $311 per square foot. 912 Royal Plum Ln is a home located in Clark County with nearby schools including John W. Bonner Elementary School, Sig Rogich Middle School, and Palo Verde High School.
Ownership History
Date
Name
Owned For
Owner Type
Purchase Details
Closed on
Apr 5, 2019
Sold by
The Crawford Family Trust
Bought by
Standish Sandra Ann and Slominski Susan
Current Estimated Value
Home Financials for this Owner
Home Financials are based on the most recent Mortgage that was taken out on this home.
Original Mortgage
$220,000
Outstanding Balance
$195,763
Interest Rate
4.3%
Mortgage Type
New Conventional
Estimated Equity
$359,989
Purchase Details
Closed on
Jan 30, 2015
Sold by
Crawofrd Andrew M and Crawofrd Kristen D
Bought by
The Crawford Family Trust
Purchase Details
Closed on
Jun 17, 2010
Sold by
Wadeson Travis G and Wadeson Kari R
Bought by
Crawford Andrew M and Crawford Kristen D
Home Financials for this Owner
Home Financials are based on the most recent Mortgage that was taken out on this home.
Original Mortgage
$165,690
Interest Rate
4.75%
Mortgage Type
FHA
Purchase Details
Closed on
Apr 15, 2008
Sold by
Cesaretti Christina
Bought by
Waderson Travis G and Wadeson Kari R
Home Financials for this Owner
Home Financials are based on the most recent Mortgage that was taken out on this home.
Original Mortgage
$259,350
Interest Rate
5.99%
Mortgage Type
Unknown
Purchase Details
Closed on
Nov 24, 2003
Sold by
Tremble Julianna and Tremble Scott
Bought by
Cesaretti Marino A
Home Financials for this Owner
Home Financials are based on the most recent Mortgage that was taken out on this home.
Original Mortgage
$216,000
Interest Rate
5.88%
Mortgage Type
Unknown
Purchase Details
Closed on
Oct 22, 2003
Sold by
Childred Paulette
Bought by
Tremble Scott and Tremble Julianna
Home Financials for this Owner
Home Financials are based on the most recent Mortgage that was taken out on this home.
Original Mortgage
$216,000
Interest Rate
5.88%
Mortgage Type
Unknown
Purchase Details
Closed on
Dec 11, 2001
Sold by
Tremble Scott and Tremble Julianna
Bought by
Tremble Scott and Tremble Julianna
Home Financials for this Owner
Home Financials are based on the most recent Mortgage that was taken out on this home.
Original Mortgage
$164,500
Interest Rate
6.57%
Purchase Details
Closed on
May 4, 1999
Sold by
The Presley Homes
Bought by
Tremble Scott and Tremble Julianna
Home Financials for this Owner
Home Financials are based on the most recent Mortgage that was taken out on this home.
Original Mortgage
$165,100
Interest Rate
6.94%
Create a Home Valuation Report for This Property
The Home Valuation Report is an in-depth analysis detailing your home's value as well as a comparison with similar homes in the area
Home Values in the Area
Average Home Value in this Area
Purchase History
| Date | Buyer | Sale Price | Title Company |
|---|---|---|---|
| Standish Sandra Ann | $380,000 | Ticor Title Las Vegas | |
| The Crawford Family Trust | -- | None Available | |
| Crawford Andrew M | $170,000 | Ticor Title Las Vegas | |
| Wadeson Travis G | -- | None Available | |
| Waderson Travis G | $273,000 | Titleone | |
| Cesaretti Marino A | $270,000 | First American Title Co Of | |
| Tremble Scott | $345,000 | Ticor Title Of Nevada Inc | |
| Tremble Scott | -- | Nevada Title Company | |
| Tremble Scott | $174,000 | First American Title Co |
Source: Public Records
Mortgage History
| Date | Status | Borrower | Loan Amount |
|---|---|---|---|
| Open | Standish Sandra Ann | $220,000 | |
| Previous Owner | Crawford Andrew M | $50,000 | |
| Previous Owner | Crawford Andrew A | $165,000 | |
| Previous Owner | Crawford Andrew M | $164,863 | |
| Previous Owner | Crawford Andrew M | $165,690 | |
| Previous Owner | Waderson Travis G | $259,350 | |
| Previous Owner | Cesaretti Marino A | $216,000 | |
| Previous Owner | Tremble Scott | $276,000 | |
| Previous Owner | Tremble Scott | $160,000 | |
| Previous Owner | Tremble Scott | $164,500 | |
| Previous Owner | Tremble Scott | $165,100 | |
| Closed | Tremble Scott | $69,000 |
Source: Public Records
Tax History Compared to Growth
Tax History
| Year | Tax Paid | Tax Assessment Tax Assessment Total Assessment is a certain percentage of the fair market value that is determined by local assessors to be the total taxable value of land and additions on the property. | Land | Improvement |
|---|---|---|---|---|
| 2025 | $2,498 | $127,685 | $59,850 | $67,835 |
| 2024 | $2,426 | $127,685 | $59,850 | $67,835 |
| 2023 | $2,426 | $109,854 | $45,500 | $64,354 |
| 2022 | $2,356 | $96,916 | $38,150 | $58,766 |
| 2021 | $2,287 | $92,080 | $36,050 | $56,030 |
| 2020 | $2,217 | $87,348 | $31,850 | $55,498 |
| 2019 | $2,190 | $85,540 | $30,800 | $54,740 |
| 2018 | $2,114 | $75,909 | $23,100 | $52,809 |
| 2017 | $2,466 | $75,051 | $21,700 | $53,351 |
| 2016 | $1,980 | $72,820 | $19,250 | $53,570 |
| 2015 | $1,975 | $66,905 | $14,000 | $52,905 |
| 2014 | $1,918 | $56,543 | $11,025 | $45,518 |
Source: Public Records
Map
Nearby Homes
- 10540 Beachwalk Place
- 10404 Shadowland Ave
- 10400 Beachwalk Place
- 10717 Beringer Dr
- 1201 Mersault Ct
- 428 Copper Valley Ct
- 10657 Blue Nile Ct
- 10241 Regents Cross Place
- 1200 Dry Point Ct
- 10325 Falls Church Ave Unit 1
- 10680 Sapphire Vista Ave
- 708 Canterbury Cross Place
- 1024 Eaglewood Dr
- 428 Madison Taylor Place
- 1309 Reisling Ct
- 10657 Sapphire Vista Ave
- 812 Eaglewood Dr
- 417 Carlton Kay Place
- 340 Autumn Palace Ct
- 10244 Amber Hue Ln
- 912 Royal Plum Ln
- 908 Royal Plum Ln
- 916 Royal Plum Ln
- 904 Royal Plum Ln
- 920 Royal Plum Ln
- 10600 Royal Willow Place
- 924 Royal Plum Ln
- 905 Royal Plum Ln
- 10601 Umbrella Tree Ct
- 820 Royal Plum Ln
- 820 Royal Plum Ln Unit none
- 820 Royal Plum Ln Unit non
- 901 Royal Plum Ln
- 909 Windhook St
- 905 Windhook St
- 913 Windhook St
- 1000 Royal Plum Ln
- 10608 Royal Willow Place
- 901 Windhook St
- 10605 Umbrella Tree Ct