N
Seller's Agent in 2014
Non-MLS Associate
Non-MLS Office

Estimated Value: $83,000 - $123,739
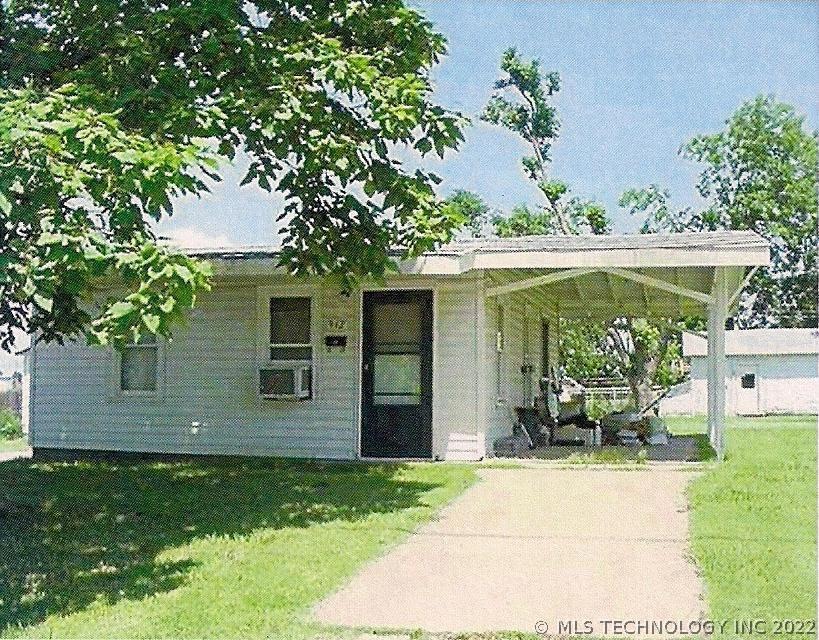
Being sold with 406 E. Pecan. Both homes are rented.
We collect this data history from publicly available records. To have your information removed, we recommend requesting removal directly through your county’s website.
| Date | Event | Price | List to Sale | Price per Sq Ft |
|---|---|---|---|---|
| 07/01/2014 07/01/14 | Sold | $21,000 | 0.0% | $19 / Sq Ft |
| 07/01/2014 07/01/14 | Pending | -- | -- | -- |
| 07/01/2014 07/01/14 | For Sale | $21,000 | -- | $19 / Sq Ft |
We collect this data history from publicly available records. To have your information removed, we recommend requesting removal directly through your county’s website.
| Year | Tax Paid | Tax Assessment Tax Assessment Total Assessment is a certain percentage of the fair market value that is determined by local assessors to be the total taxable value of land and additions on the property. | Land | Improvement |
|---|---|---|---|---|
| 2025 | $414 | $5,500 | $203 | $5,297 |
| 2024 | $381 | $5,500 | $203 | $5,297 |
| 2023 | $381 | $5,340 | $209 | $5,131 |
| 2022 | $357 | $5,185 | $246 | $4,939 |
| 2021 | $335 | $5,034 | $258 | $4,776 |
| 2020 | $318 | $4,887 | $237 | $4,650 |
| 2019 | $321 | $4,746 | $380 | $4,366 |
| 2018 | $299 | $4,607 | $369 | $4,238 |
| 2017 | $286 | $4,473 | $376 | $4,097 |
| 2016 | $282 | $4,342 | $367 | $3,975 |
| 2015 | $279 | $4,216 | $359 | $3,857 |
| 2014 | $267 | $4,094 | $359 | $3,735 |
N
Seller's Agent in 2014
Non-MLS Associate
Non-MLS Office
Source: MLS Technology
MLS Number: 1747224
APN: 600001844
Disclaimer: Certain information contained herein is derived from information provided by parties other than Homes.com. All information provided is deemed reliable, but is not guaranteed to be accurate and should be independently verified.
![]() IDX information is provided exclusively for personal, non-commercial use, and may not be used for any purpose other than to identify prospective properties consumers may be interested in purchasing.
IDX information is provided exclusively for personal, non-commercial use, and may not be used for any purpose other than to identify prospective properties consumers may be interested in purchasing.
Information is deemed reliable but not guaranteed.
Ask me questions while you tour the home.
