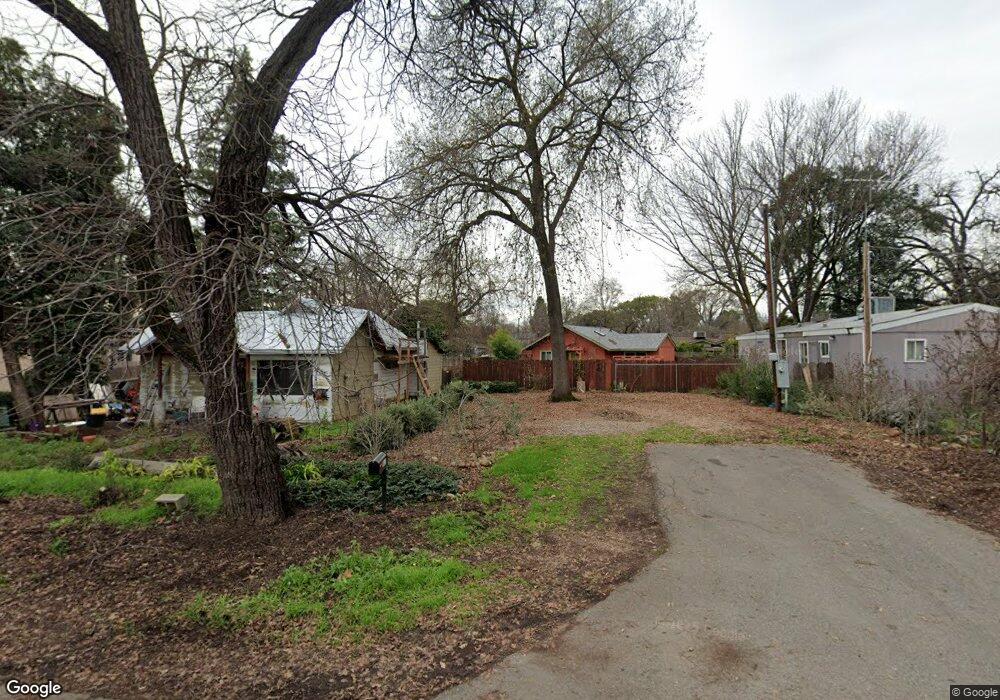
912 Sycamore St Chico, CA 95928
Eastwood NeighborhoodEstimated Value: $177,000 - $291,000
1
Bed
1
Bath
448
Sq Ft
$491/Sq Ft
Est. Value
About This Home
This home is located at 912 Sycamore St, Chico, CA 95928 and is currently estimated at $220,158, approximately $491 per square foot. 912 Sycamore St is a home with nearby schools including Parkview Elementary School, Chico Junior High School, and Chico High School.
Ownership History
Date
Name
Owned For
Owner Type
Purchase Details
Closed on
Nov 14, 2017
Sold by
Polivaka Ann Christine
Bought by
Polivaka Ann and The Ann Polivaka Revocable Trust
Current Estimated Value
Purchase Details
Closed on
Sep 5, 2012
Sold by
Larabee Leslie and The La Donna L Bennett Living
Bought by
Pollvka Ann Christine
Purchase Details
Closed on
Mar 30, 2010
Sold by
Larabee Leslie and La Donna L Bennett Living Trus
Bought by
Larabee Leslie and La Donna L Bennett Living Trust
Purchase Details
Closed on
Apr 16, 2008
Sold by
Bennett La Donna
Bought by
Bennett La Donna L and La Donna L Bennett Living Trust
Home Financials for this Owner
Home Financials are based on the most recent Mortgage that was taken out on this home.
Original Mortgage
$4,044
Interest Rate
5.81%
Mortgage Type
Purchase Money Mortgage
Create a Home Valuation Report for This Property
The Home Valuation Report is an in-depth analysis detailing your home's value as well as a comparison with similar homes in the area
Home Values in the Area
Average Home Value in this Area
Purchase History
| Date | Buyer | Sale Price | Title Company |
|---|---|---|---|
| Polivaka Ann | -- | None Available | |
| Pollvka Ann Christine | $25,000 | Mid Valley Title & Escrow Co | |
| Larabee Leslie | -- | None Available | |
| Bennett La Donna L | -- | None Available |
Source: Public Records
Mortgage History
| Date | Status | Borrower | Loan Amount |
|---|---|---|---|
| Previous Owner | Bennett La Donna L | $4,044 |
Source: Public Records
Tax History Compared to Growth
Tax History
| Year | Tax Paid | Tax Assessment Tax Assessment Total Assessment is a certain percentage of the fair market value that is determined by local assessors to be the total taxable value of land and additions on the property. | Land | Improvement |
|---|---|---|---|---|
| 2025 | $1,256 | $114,181 | $43,038 | $71,143 |
| 2024 | $1,256 | $111,944 | $42,195 | $69,749 |
| 2023 | $1,241 | $109,750 | $41,368 | $68,382 |
| 2022 | $1,220 | $107,599 | $40,557 | $67,042 |
| 2021 | $1,196 | $105,490 | $39,762 | $65,728 |
| 2020 | $1,193 | $104,410 | $39,355 | $65,055 |
| 2019 | $1,173 | $102,364 | $38,584 | $63,780 |
| 2018 | $980 | $85,358 | $37,828 | $47,530 |
| 2017 | $960 | $83,686 | $37,087 | $46,599 |
| 2016 | $878 | $82,046 | $36,360 | $45,686 |
| 2015 | $877 | $80,814 | $35,814 | $45,000 |
| 2014 | $795 | $72,113 | $35,113 | $37,000 |
Source: Public Records
Map
Nearby Homes
- 1077 E 8th St
- 1169 E 9th St
- 667 E 8th St
- 735 Pine St
- 1372 Davis St
- 1158 E 7th St
- 1418 Martin St
- 0 California 32
- 1326 Mulberry St
- 555 Vallombrosa Ave Unit 65
- 555 Vallombrosa Ave Unit 39
- 1368 E 9th St
- 1617 Hemlock St
- 573 E 19th St
- 1805 Hemlock St
- 770 E 20th St
- 0 Fair St Unit SN25230897
- 1220 Broadway St
- 1001 Salem St
- 1029 Salem St
- 914 Sycamore St
- 925 Alder St
- 923 Alder St
- 927 Alder St
- 918 Sycamore St
- 919 Alder St
- 1003 Alder St
- 911 Alder St
- 1010 Sycamore St
- 1007 Alder St
- 989 E 9th St
- 910 Sycamore St
- 971 E 9th St
- 1012 Sycamore St
- 1016 Sycamore St
- 919 Sycamore St
- 1021 Alder St Unit 1
- 1021 Alder St
- 941 Sycamore St
- 939 Sycamore St