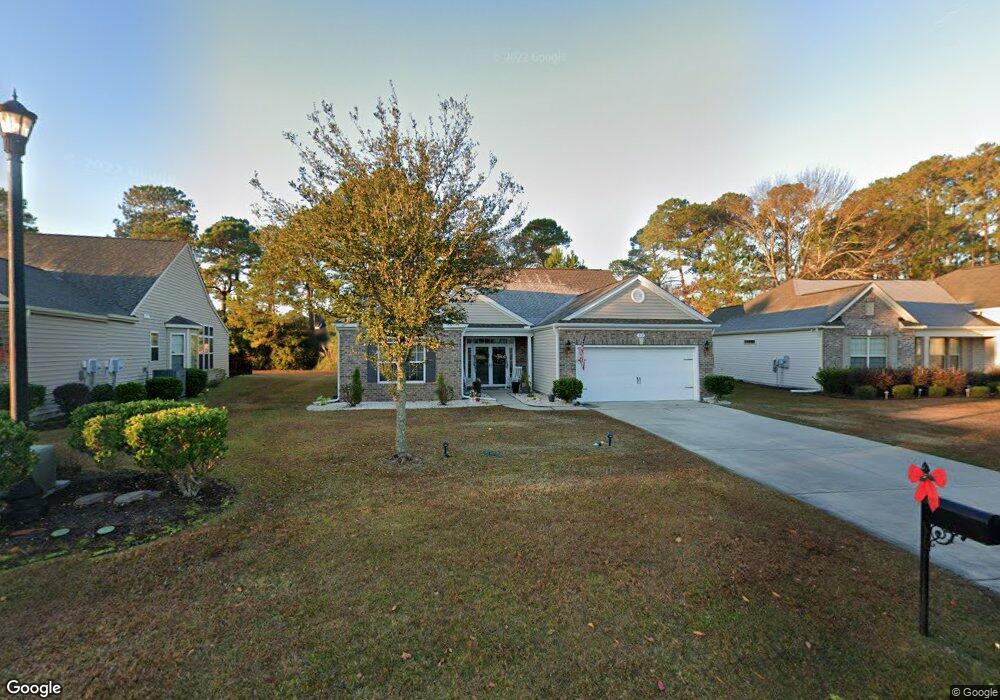
912 Welkin Ct Unit Lt. 21 Conway, SC 29526
Estimated Value: $357,000 - $405,000
3
Beds
3
Baths
2,308
Sq Ft
$164/Sq Ft
Est. Value
About This Home
This home is located at 912 Welkin Ct Unit Lt. 21, Conway, SC 29526 and is currently estimated at $378,715, approximately $164 per square foot. 912 Welkin Ct Unit Lt. 21 is a home located in Horry County with nearby schools including Carolina Forest Elementary School, Ten Oaks Middle, and Carolina Forest High School.
Ownership History
Date
Name
Owned For
Owner Type
Purchase Details
Closed on
Mar 18, 2024
Sold by
Oakes Debra J
Bought by
Oakes Debra J and Oakes Denise J
Current Estimated Value
Purchase Details
Closed on
Apr 24, 2018
Sold by
Beach Capital Partners Llc
Bought by
Oakes Thomas W and Oakes Debra J
Home Financials for this Owner
Home Financials are based on the most recent Mortgage that was taken out on this home.
Original Mortgage
$95,000
Interest Rate
4.44%
Mortgage Type
New Conventional
Purchase Details
Closed on
Oct 16, 2017
Sold by
Us Bank Association
Bought by
Beach Capital Partners Llc
Home Financials for this Owner
Home Financials are based on the most recent Mortgage that was taken out on this home.
Original Mortgage
$157,500
Interest Rate
3.78%
Mortgage Type
New Conventional
Purchase Details
Closed on
Oct 19, 2016
Sold by
Master Of Horry County
Bought by
West Ridge Owners Assn Inc
Purchase Details
Closed on
Jan 5, 2011
Sold by
Dr Horton
Bought by
Pringle Shaeton A
Create a Home Valuation Report for This Property
The Home Valuation Report is an in-depth analysis detailing your home's value as well as a comparison with similar homes in the area
Home Values in the Area
Average Home Value in this Area
Purchase History
| Date | Buyer | Sale Price | Title Company |
|---|---|---|---|
| Oakes Debra J | -- | -- | |
| Oakes Thomas W | $194,000 | -- | |
| Beach Capital Partners Llc | $157,500 | -- | |
| West Ridge Owners Assn Inc | $2,500 | -- | |
| Pringle Shaeton A | $205,000 | -- |
Source: Public Records
Mortgage History
| Date | Status | Borrower | Loan Amount |
|---|---|---|---|
| Previous Owner | Oakes Thomas W | $95,000 | |
| Previous Owner | Beach Capital Partners Llc | $157,500 |
Source: Public Records
Tax History
| Year | Tax Paid | Tax Assessment Tax Assessment Total Assessment is a certain percentage of the fair market value that is determined by local assessors to be the total taxable value of land and additions on the property. | Land | Improvement |
|---|---|---|---|---|
| 2025 | $845 | $0 | $0 | $0 |
| 2024 | $845 | $14,334 | $3,225 | $11,109 |
| 2023 | $753 | $8,020 | $1,436 | $6,584 |
| 2021 | $659 | $8,020 | $1,436 | $6,584 |
| 2020 | $568 | $8,020 | $1,436 | $6,584 |
| 2019 | $568 | $8,020 | $1,436 | $6,584 |
| 2018 | $536 | $7,487 | $1,407 | $6,080 |
| 2017 | $0 | $11,231 | $2,111 | $9,120 |
| 2016 | -- | $11,231 | $2,111 | $9,120 |
| 2015 | $2,418 | $11,231 | $2,111 | $9,120 |
| 2014 | $2,337 | $11,231 | $2,111 | $9,120 |
Source: Public Records
Map
Nearby Homes
- 110 Cart Crossing Dr Unit 102
- 120 Cart Crossing Dr Unit 104
- 150 Cart Crossing Dr Unit 103
- 708 Walking Fern Ct
- 611 Woodman Dr
- 145 Ridge Point Dr
- 195 Willow Green Dr Unit D
- 195 Willow Green Dr
- 1308 Wellfound Ct
- 1004 Woodall Ct
- 380 Myrtle Greens Dr Unit F
- 137 Hickory Dr
- 827 Helms Way
- 891 Helms Way
- 1212 Loblolly Ln
- 460 Myrtle Greens Dr Unit 460
- 1215 Loblolly Ln
- 1217 Loblolly Ln
- 8207 Timber Ridge Rd
- 115 Hickory Dr Unit MB
- 912 Welkin Ct
- 916 Welkin Ct Unit Lt. 22-Cumberland
- 908 Welkin Ct
- 908 Welkin Ct Unit lot 20 -STOCKTON B P
- 920 Welkin Ct
- 904 Welkin Ct
- 904 Welkin Ct Unit Lot 19 -PALMETTO F
- 8125 Timber Ridge Rd
- 110 Cart Crossing Dr
- 110 Cart Crossing Dr Unit 105 Willow Trace
- 110 Cart Crossing Dr Unit 8106
- 110 Cart Crossing Dr Unit 8105
- 110 Cart Crossing Dr Unit 8104
- 110 Cart Crossing Dr Unit 8103
- 110 Cart Crossing Dr Unit 8102
- 110 Cart Crossing Dr Unit 8101
- 8121 Timber Ridge Rd
- 8127 Timber Ridge Rd
- 900 Welkin Ct
- 900 Welkin Ct Unit Lot 18 Garrett
Your Personal Tour Guide
Ask me questions while you tour the home.