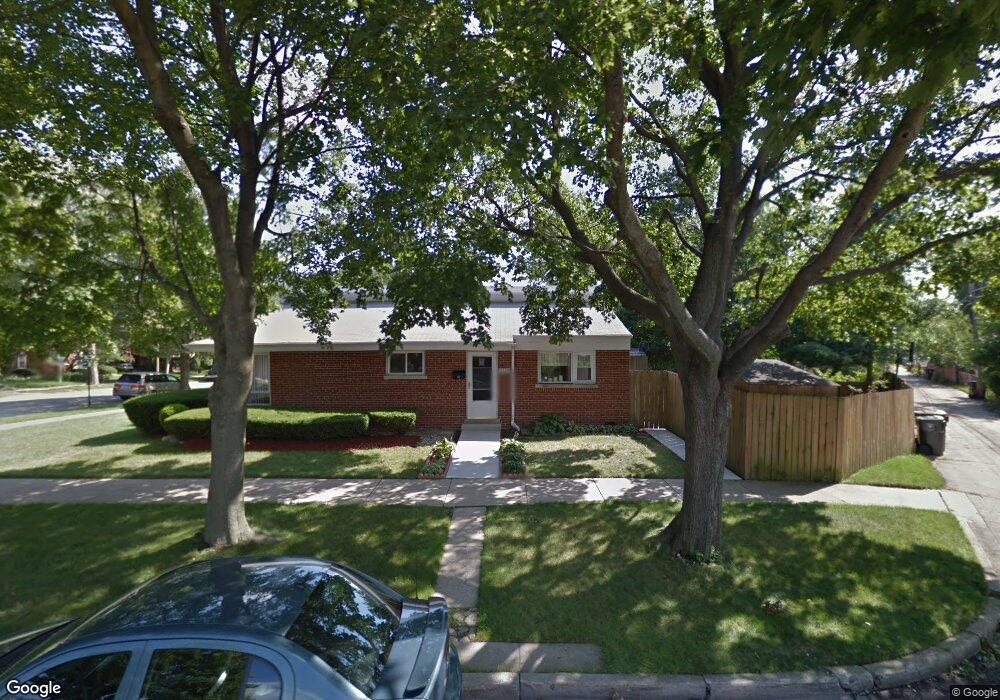
9122 Forestview Rd Evanston, IL 60203
North Skokie NeighborhoodEstimated Value: $429,000 - $503,000
3
Beds
2
Baths
1,140
Sq Ft
$401/Sq Ft
Est. Value
About This Home
This home is located at 9122 Forestview Rd, Evanston, IL 60203 and is currently estimated at $457,485, approximately $401 per square foot. 9122 Forestview Rd is a home located in Cook County with nearby schools including Walker Elementary School, Chute Middle School, and Evanston Township High School.
Ownership History
Date
Name
Owned For
Owner Type
Purchase Details
Closed on
Apr 23, 2007
Sold by
Lisle Brian R and Lisle Pia B
Bought by
Terrazaz Monico and Terrazaz Mireya
Current Estimated Value
Home Financials for this Owner
Home Financials are based on the most recent Mortgage that was taken out on this home.
Original Mortgage
$210,000
Interest Rate
6.73%
Mortgage Type
Unknown
Purchase Details
Closed on
May 1, 2003
Sold by
Frada Mitchel Thomas and Frada Mitchel
Bought by
Lisle Brian R and Lisle Pia B
Home Financials for this Owner
Home Financials are based on the most recent Mortgage that was taken out on this home.
Original Mortgage
$224,000
Interest Rate
5.88%
Mortgage Type
Unknown
Create a Home Valuation Report for This Property
The Home Valuation Report is an in-depth analysis detailing your home's value as well as a comparison with similar homes in the area
Home Values in the Area
Average Home Value in this Area
Purchase History
| Date | Buyer | Sale Price | Title Company |
|---|---|---|---|
| Terrazaz Monico | $390,000 | None Available | |
| Lisle Brian R | $280,000 | -- | |
| Lisle Brian R | $280,000 | -- |
Source: Public Records
Mortgage History
| Date | Status | Borrower | Loan Amount |
|---|---|---|---|
| Previous Owner | Terrazaz Monico | $210,000 | |
| Previous Owner | Lisle Brian R | $224,000 |
Source: Public Records
Tax History Compared to Growth
Tax History
| Year | Tax Paid | Tax Assessment Tax Assessment Total Assessment is a certain percentage of the fair market value that is determined by local assessors to be the total taxable value of land and additions on the property. | Land | Improvement |
|---|---|---|---|---|
| 2024 | $8,012 | $37,000 | $6,300 | $30,700 |
| 2023 | $7,668 | $37,000 | $6,300 | $30,700 |
| 2022 | $7,668 | $37,000 | $6,300 | $30,700 |
| 2021 | $7,470 | $31,968 | $4,331 | $27,637 |
| 2020 | $7,411 | $31,968 | $4,331 | $27,637 |
| 2019 | $7,308 | $35,130 | $4,331 | $30,799 |
| 2018 | $6,819 | $28,638 | $3,806 | $24,832 |
| 2017 | $6,680 | $28,638 | $3,806 | $24,832 |
| 2016 | $6,551 | $28,638 | $3,806 | $24,832 |
| 2015 | $5,004 | $21,521 | $3,281 | $18,240 |
| 2014 | $5,667 | $24,207 | $3,281 | $20,926 |
| 2013 | $5,587 | $24,207 | $3,281 | $20,926 |
Source: Public Records
Map
Nearby Homes
- 1633 Mcdaniel Ave
- 8822 Forestview Rd
- 75 Williamsburg Rd
- 9433 Lincolnwood Dr
- 9435 Central Park Ave
- 8728 Trumbull Ave
- 1808 Laurel Ave
- 1811 Laurel Ave
- 8713 Drake Ave
- 1718 Hovland Ct
- 2440 Simpson St
- 8613 Trumbull Ave
- 8646 E Prairie Rd
- 1126 Pitner Ave
- 1112 Pitner Ave
- 2101 Pioneer Rd
- 1801 Brown Ave
- 2221 Lincolnwood Dr
- 8600 E Prairie Rd
- 2011 Grey Ave
- 9118 Forestview Rd
- 9112 Forestview Rd
- 3440 Arcadia St
- 9129 E Prairie Rd
- 9110 Forestview Rd
- 9145 E Prairie Rd
- 9121 E Prairie Rd
- 9121 E Prairie Rd
- 3422 Arcadia St
- 3416 Arcadia St
- 9153 E Prairie Rd
- 9125 Forestview Rd
- 9121 Forestview Rd
- 9115 E Prairie Rd
- 9115 E Prairie Rd
- 9115 Forestview Rd
- 9111 Forestview Rd
- 9111 Forestview Rd
- 3412 Arcadia St
- 9107 Forestview Rd