C
Seller's Agent in 2025
Cheryl Zook
ReeceNichols -Johnson County W
(816) 820-8608
7 in this area
41 Total Sales
Estimated Value: $379,000 - $406,000
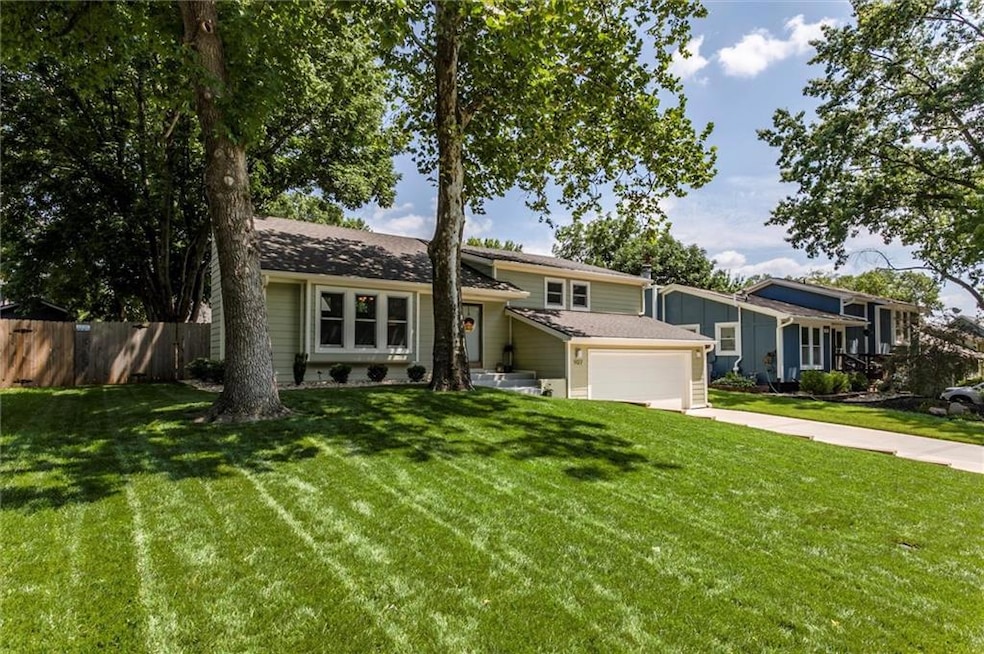
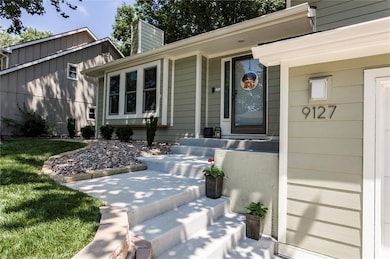
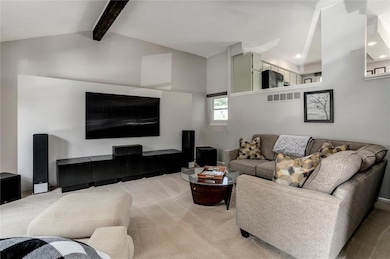
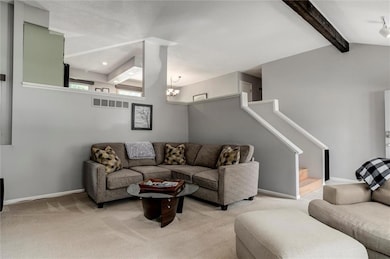
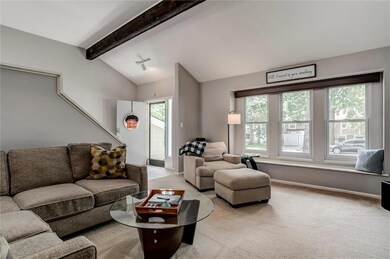
Don’t miss this well-cared-for home with lots of updates throughout, including a newer driveway, sprinkler system, oversized sliding glass door in the dining area, and freshly power-washed decks, and many many more. (Ask your agent to download the long list in the supplements, or reach out to me.) The spacious living room currently features a temporary wall for a media area, which can easily be removed to reveal the fireplace.
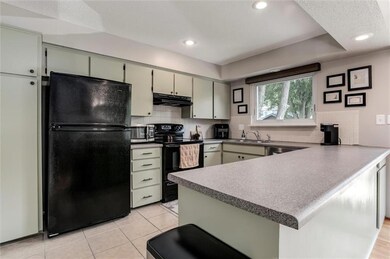
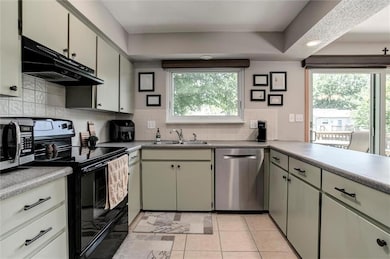
Upstairs, you'll find the kitchen and dining area with access to a large deck that overlooks the beautiful backyard—perfect for relaxing or entertaining. The primary bedroom offers generous space, an en-suite bath, and its own private deck for morning coffee or evening unwinding.
The lower level features a comfortable family room with plenty of flexibility—ideal for a home office, workout area, or playroom.
Lots to see, don't miss this one!
Last Agent to Sell the Property
ReeceNichols -Johnson County W Brokerage Phone: 816-820-8608 License #BR00218279 Listed on: 07/30/2025

We collect this data history from publicly available records. To have your information removed, we recommend requesting removal directly through your county’s website.
We collect this data history from publicly available records. To have your information removed, we recommend requesting removal directly through your county’s website.
| Date | Buyer | Sale Price | Title Company |
|---|---|---|---|
| -- | Security 1St Title | ||
| -- | Continental Title | ||
| -- | -- | ||
| -- | Security Land Title Company |
We collect this data history from publicly available records. To have your information removed, we recommend requesting removal directly through your county’s website.
| Date | Status | Borrower | Loan Amount |
|---|---|---|---|
| Previous Owner | $176,641 | ||
| Previous Owner | $139,700 |
We collect this data history from publicly available records. To have your information removed, we recommend requesting removal directly through your county’s website.
| Date | Event | Price | List to Sale | Price per Sq Ft |
|---|---|---|---|---|
| 09/10/2025 09/10/25 | Sold | -- | -- | -- |
| 08/10/2025 08/10/25 | Pending | -- | -- | -- |
| 08/07/2025 08/07/25 | For Sale | $370,000 | -- | $185 / Sq Ft |
We collect this data history from publicly available records. To have your information removed, we recommend requesting removal directly through your county’s website.
| Year | Tax Paid | Tax Assessment Tax Assessment Total Assessment is a certain percentage of the fair market value that is determined by local assessors to be the total taxable value of land and additions on the property. | Land | Improvement |
|---|---|---|---|---|
| 2025 | $4,312 | $39,549 | $7,671 | $31,878 |
| 2024 | $4,109 | $37,237 | $6,673 | $30,564 |
| 2023 | $3,988 | $35,408 | $6,673 | $28,735 |
| 2022 | $3,515 | $31,165 | $5,804 | $25,361 |
| 2021 | $3,475 | $29,176 | $5,526 | $23,650 |
| 2020 | $3,303 | $27,439 | $5,526 | $21,913 |
| 2019 | $3,082 | $25,564 | $4,603 | $20,961 |
| 2018 | $2,777 | $24,207 | $4,603 | $19,604 |
| 2017 | $2,859 | $22,759 | $4,009 | $18,750 |
| 2016 | $2,663 | $20,907 | $4,009 | $16,898 |
| 2015 | $2,608 | $20,620 | $4,009 | $16,611 |
| 2013 | -- | $19,746 | $4,009 | $15,737 |
C
Seller's Agent in 2025
Cheryl Zook
ReeceNichols -Johnson County W
(816) 820-8608
7 in this area
41 Total Sales
N
Buyer's Agent in 2025
Nick Wagoner
Real Broker, LLC
(913) 227-5462
13 in this area
164 Total Sales
Source: Heartland MLS
MLS Number: 2566113
APN: IP05000003-0008
Disclaimer: Certain information contained herein is derived from information provided by parties other than Homes.com. All information provided is deemed reliable, but is not guaranteed to be accurate and should be independently verified.
![]() All data is obtained from various sources and may not have been verified by broker or MLS GRID. Supplied Open House Information is subject to change without notice. All information should be independently reviewed and verified for accuracy. Properties may or may not be listed by the office/agent presenting the information. Some IDX listings have been excluded from this website. Prices displayed on all Sold listings are the Last Known Listing Price and may not be the actual selling price.
All data is obtained from various sources and may not have been verified by broker or MLS GRID. Supplied Open House Information is subject to change without notice. All information should be independently reviewed and verified for accuracy. Properties may or may not be listed by the office/agent presenting the information. Some IDX listings have been excluded from this website. Prices displayed on all Sold listings are the Last Known Listing Price and may not be the actual selling price.
Listings courtesy of Heartland MLS as distributed by MLS GRID.
Based on information submitted to the MLS GRID
Listing Information presented by local MLS brokerage: TEN-X, INC., local REALTOR®- Arlene Richardson - (888) 952-6393
Ask me questions while you tour the home.