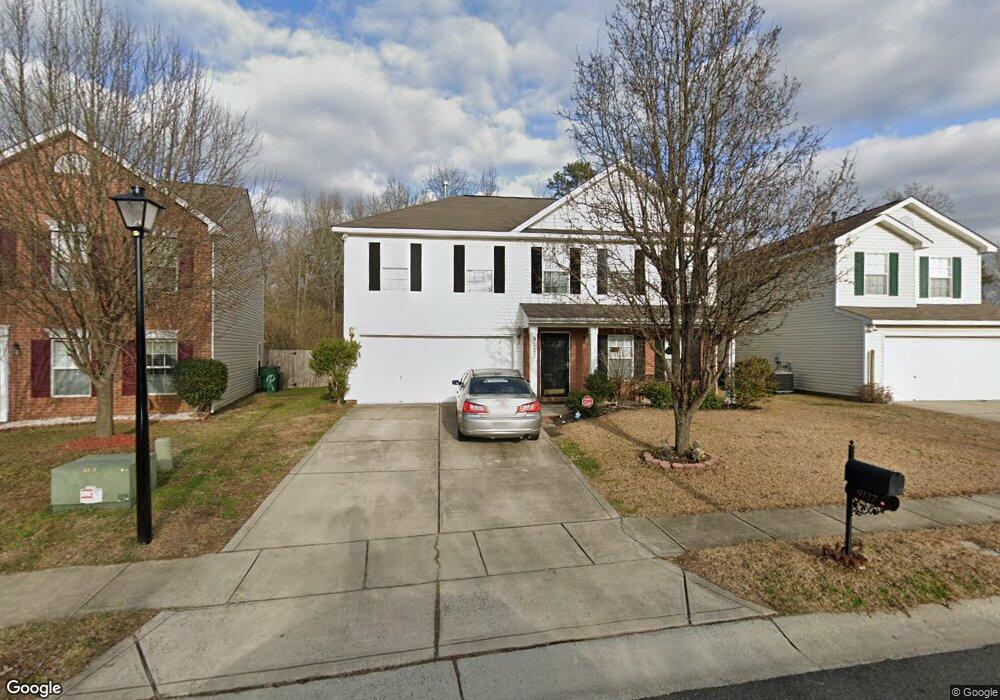
9127 Tibble Creek Way Charlotte, NC 28227
Marshbrooke NeighborhoodEstimated Value: $376,000 - $463,000
3
Beds
3
Baths
2,240
Sq Ft
$183/Sq Ft
Est. Value
About This Home
This home is located at 9127 Tibble Creek Way, Charlotte, NC 28227 and is currently estimated at $410,776, approximately $183 per square foot. 9127 Tibble Creek Way is a home located in Mecklenburg County with nearby schools including Crown Point Elementary, Mint Hill Middle School, and Butler High School.
Ownership History
Date
Name
Owned For
Owner Type
Purchase Details
Closed on
Mar 29, 2019
Sold by
Royal Jakeem A and Royal Jakeem A
Bought by
Royal Jacqueline M
Current Estimated Value
Purchase Details
Closed on
Jan 1, 2016
Sold by
Huang Qi H and Huang Yu Juan
Bought by
Royal Jacqueline M and Royal Jakeem A
Home Financials for this Owner
Home Financials are based on the most recent Mortgage that was taken out on this home.
Original Mortgage
$175,757
Outstanding Balance
$141,761
Interest Rate
4.4%
Mortgage Type
FHA
Estimated Equity
$269,015
Purchase Details
Closed on
May 9, 2002
Sold by
Crossmann Communities Of Nc Inc
Bought by
Huang Qi H and Huang Yu Juan
Home Financials for this Owner
Home Financials are based on the most recent Mortgage that was taken out on this home.
Original Mortgage
$110,625
Interest Rate
7.18%
Create a Home Valuation Report for This Property
The Home Valuation Report is an in-depth analysis detailing your home's value as well as a comparison with similar homes in the area
Home Values in the Area
Average Home Value in this Area
Purchase History
| Date | Buyer | Sale Price | Title Company |
|---|---|---|---|
| Royal Jacqueline M | -- | None Available | |
| Royal Jacqueline M | $179,000 | None Available | |
| Huang Qi H | $148,000 | -- |
Source: Public Records
Mortgage History
| Date | Status | Borrower | Loan Amount |
|---|---|---|---|
| Open | Royal Jacqueline M | $175,757 | |
| Previous Owner | Huang Qi H | $110,625 |
Source: Public Records
Tax History Compared to Growth
Tax History
| Year | Tax Paid | Tax Assessment Tax Assessment Total Assessment is a certain percentage of the fair market value that is determined by local assessors to be the total taxable value of land and additions on the property. | Land | Improvement |
|---|---|---|---|---|
| 2025 | $3,114 | $391,000 | $70,000 | $321,000 |
| 2024 | $3,114 | $391,000 | $70,000 | $321,000 |
| 2023 | $2,342 | $390,300 | $70,000 | $320,300 |
| 2022 | $2,266 | $221,800 | $45,000 | $176,800 |
| 2021 | $2,255 | $221,800 | $45,000 | $176,800 |
| 2020 | $2,248 | $221,800 | $45,000 | $176,800 |
| 2019 | $2,232 | $221,800 | $45,000 | $176,800 |
| 2018 | $1,997 | $146,600 | $19,000 | $127,600 |
| 2017 | $1,961 | $146,600 | $19,000 | $127,600 |
| 2016 | $1,951 | $146,600 | $19,000 | $127,600 |
| 2015 | $1,940 | $146,600 | $19,000 | $127,600 |
| 2014 | -- | $146,700 | $18,800 | $127,900 |
Source: Public Records
Map
Nearby Homes
- 9005 Louvaine Dr
- 9320 Tibble Creek Way
- 3012 Longspur Dr
- 8702 Wood Sorrel Ct
- 4220 Melrose Club Dr
- 4240 Bathurst Dr
- 8901 Clifton Meadow Dr
- 5448 Wyalong Dr
- 3657 Melrose Cottage Dr
- 3807 Broomstraw Ct
- 3602 Melrose Cottage Dr
- 2901 Vestal Place
- 2834 Overlook Trail
- 3220 Wiseman Dr
- 9919 Treeside Ln
- 3329 Fortis Ln
- 4028 Grommet Ct
- 4044 Grommet Ct
- 4020 Grommet Ct
- 4032 Grommet Ct
- 9127 Tibble Creek Way Unit 9
- 9123 Tibble Creek Way
- 9123 Tibble Creek Way Unit 8
- 9131 Tibble Creek Way
- 9119 Tibble Creek Way
- 9119 Tibble Creek Way Unit 27
- 9130 Tibble Creek Way
- 9205 Tibble Creek Way
- 9124 Tibble Creek Way Unit 66
- 9124 Tibble Creek Way
- 9115 Tibble Creek Way
- 8825 Vicksburg Rd
- 9200 Tibble Creek Way
- 9118 Tibble Creek Way
- 9111 Tibble Creek Way
- 9000 Louvaine Dr
- 9206 Tibble Creek Way
- 9114 Tibble Creek Way
- 8829 Vicksburg Rd
- 9001 Louvaine Dr