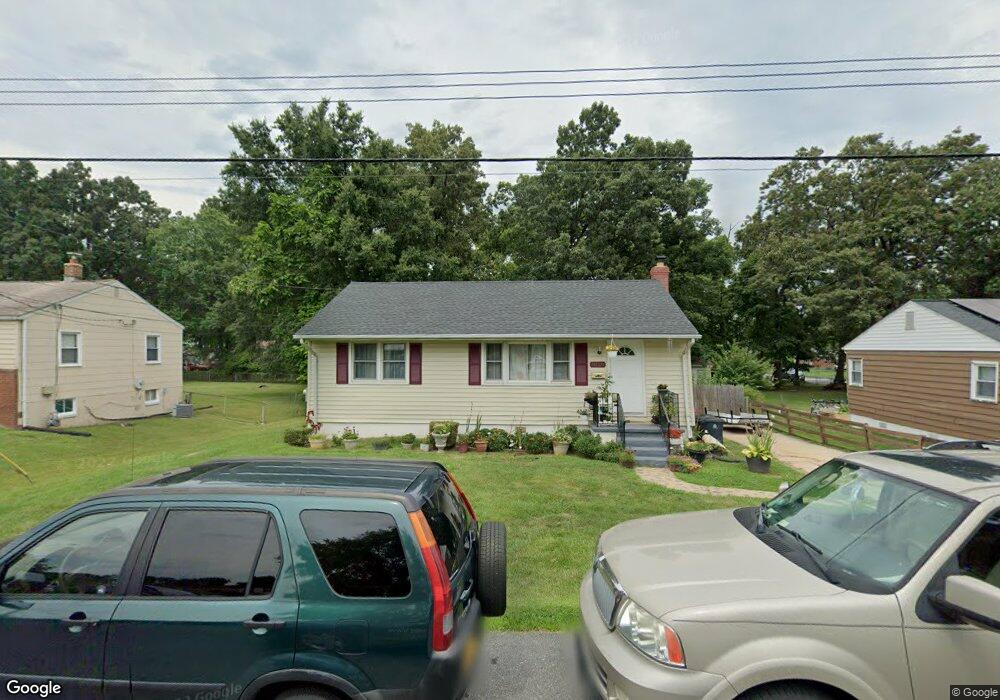
9128 8th St Lanham, MD 20706
Estimated Value: $367,000 - $440,000
3
Beds
1
Bath
1,056
Sq Ft
$378/Sq Ft
Est. Value
About This Home
This home is located at 9128 8th St, Lanham, MD 20706 and is currently estimated at $398,715, approximately $377 per square foot. 9128 8th St is a home located in Prince George's County with nearby schools including Gaywood Elementary School, Thomas Johnson Middle School, and Duval High School.
Ownership History
Date
Name
Owned For
Owner Type
Purchase Details
Closed on
Jan 30, 2025
Sold by
Tan Hsiu Chun
Bought by
Tan Hsiu C and Tan Clifton Chunwei
Current Estimated Value
Purchase Details
Closed on
Apr 3, 2023
Sold by
Tan Hsiu Chun and Tsai Cheng Han
Bought by
Tan Hsiu Chun
Purchase Details
Closed on
Aug 22, 2015
Sold by
Chen Chang Hsiu Tsai and Tan Hsiu Chun
Bought by
Tan Hsiu Chun and Tsai Cheng Han
Purchase Details
Closed on
Dec 31, 2014
Sold by
Spence Pernell S and Posey Shannon N
Bought by
Tan Hsiuchun and Chen Chang Hsiu Tsai
Purchase Details
Closed on
Jan 6, 2014
Sold by
Spence Pernell S and Spence Shannon N
Bought by
Spence Pernell S
Purchase Details
Closed on
Jun 22, 2000
Sold by
Vandergriff Carol L
Bought by
Spence Pernell S and Posey Shannon N
Purchase Details
Closed on
Nov 18, 1975
Sold by
Gallahan Carl J
Bought by
Vandergriff Carol L
Create a Home Valuation Report for This Property
The Home Valuation Report is an in-depth analysis detailing your home's value as well as a comparison with similar homes in the area
Home Values in the Area
Average Home Value in this Area
Purchase History
| Date | Buyer | Sale Price | Title Company |
|---|---|---|---|
| Tan Hsiu C | -- | None Listed On Document | |
| Tan Hsiu C | -- | None Listed On Document | |
| Tan Hsiu Chun | $150,000 | Eastern Title | |
| Tan Hsiu Chun | $150,000 | Eastern Title | |
| Tan Hsiu Chun | -- | Eastern Title & Settlement | |
| Tan Hsiuchun | $160,000 | Eastern Title & Settlement | |
| Spence Pernell S | -- | None Available | |
| Spence Pernell S | $118,000 | -- | |
| Vandergriff Carol L | $41,000 | -- |
Source: Public Records
Tax History
| Year | Tax Paid | Tax Assessment Tax Assessment Total Assessment is a certain percentage of the fair market value that is determined by local assessors to be the total taxable value of land and additions on the property. | Land | Improvement |
|---|---|---|---|---|
| 2025 | $3,017 | $310,700 | -- | -- |
| 2024 | $3,017 | $291,000 | -- | -- |
| 2023 | $3,017 | $271,300 | $71,400 | $199,900 |
| 2022 | $2,970 | $267,067 | $0 | $0 |
| 2021 | $3,537 | $262,833 | $0 | $0 |
| 2020 | $4,241 | $258,600 | $70,700 | $187,900 |
| 2019 | $3,378 | $235,867 | $0 | $0 |
| 2018 | $3,565 | $213,133 | $0 | $0 |
| 2017 | $3,089 | $190,400 | $0 | $0 |
| 2016 | -- | $181,100 | $0 | $0 |
| 2015 | $2,866 | $171,800 | $0 | $0 |
| 2014 | $2,866 | $162,500 | $0 | $0 |
Source: Public Records
Map
Nearby Homes
- 9104 8th St
- 0 Franklin Ave Unit MDPG2190164
- 9300 Worrell Ave
- 9223 4th St
- 9208 4th St
- 9102 4th St
- 9305 4th St
- 6306 Hardwood Dr
- 6311 Barrs Ln
- 6112 Naval Ave
- 5613 Gregory Dr
- 9104 Sheridan Ct
- 9301 Tuckerman St
- 9434 Dubarry Ave
- 10535 John Glenn St
- 9011 Good Luck Rd
- 9410 Van Buren St
- 9309 Kimbark Ave
- 9524 Dubarry Ave
- 9616 Block St
Your Personal Tour Guide
Ask me questions while you tour the home.