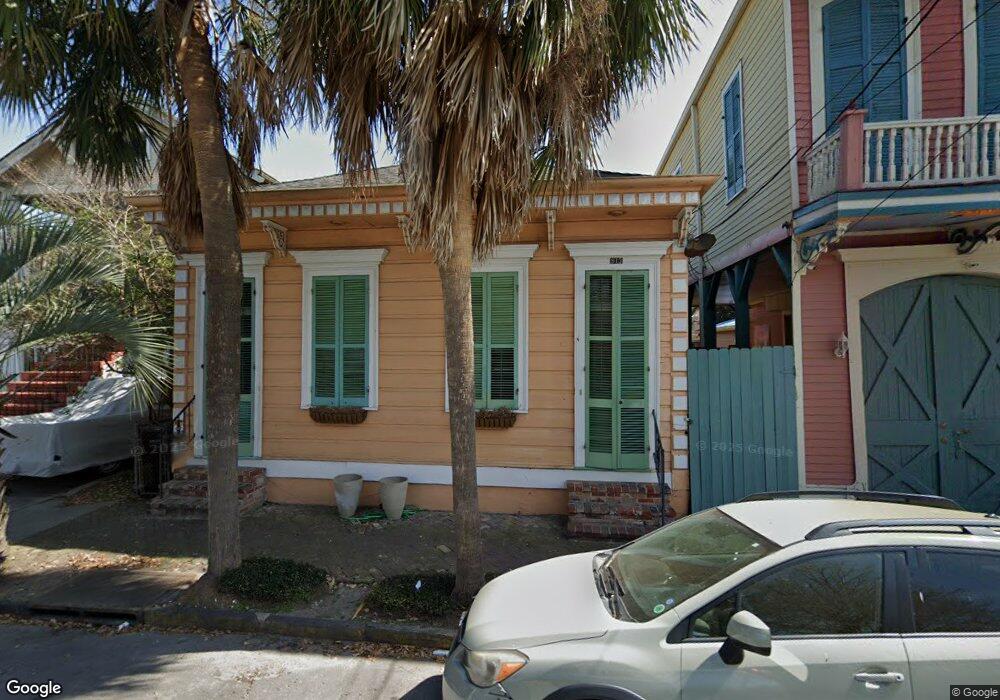
913 8th St New Orleans, LA 70115
Irish Channel NeighborhoodEstimated Value: $492,838 - $549,000
2
Beds
2
Baths
1,512
Sq Ft
$345/Sq Ft
Est. Value
About This Home
This home is located at 913 8th St, New Orleans, LA 70115 and is currently estimated at $521,960, approximately $345 per square foot. 913 8th St is a home located in Orleans Parish with nearby schools including ReNEW Laurel Academy, Audubon Uptown Upper School, and Benjamin Franklin Middle School.
Ownership History
Date
Name
Owned For
Owner Type
Purchase Details
Closed on
Dec 23, 2014
Sold by
Alexander Tamieka A F
Bought by
Storper Amy S
Current Estimated Value
Purchase Details
Closed on
Nov 16, 2012
Sold by
Schumacher Jennifer
Bought by
Frazier Tamieka A and Alexander Thomas A
Home Financials for this Owner
Home Financials are based on the most recent Mortgage that was taken out on this home.
Original Mortgage
$337,250
Interest Rate
3.43%
Create a Home Valuation Report for This Property
The Home Valuation Report is an in-depth analysis detailing your home's value as well as a comparison with similar homes in the area
Home Values in the Area
Average Home Value in this Area
Purchase History
| Date | Buyer | Sale Price | Title Company |
|---|---|---|---|
| Storper Amy S | $393,400 | -- | |
| Frazier Tamieka A | $355,000 | -- |
Source: Public Records
Mortgage History
| Date | Status | Borrower | Loan Amount |
|---|---|---|---|
| Previous Owner | Frazier Tamieka A | $337,250 |
Source: Public Records
Tax History Compared to Growth
Tax History
| Year | Tax Paid | Tax Assessment Tax Assessment Total Assessment is a certain percentage of the fair market value that is determined by local assessors to be the total taxable value of land and additions on the property. | Land | Improvement |
|---|---|---|---|---|
| 2025 | $6,618 | $50,140 | $14,220 | $35,920 |
| 2024 | $5,423 | $40,470 | $14,220 | $26,250 |
| 2023 | $3,345 | $31,870 | $6,100 | $25,770 |
| 2022 | $3,345 | $30,580 | $6,100 | $24,480 |
| 2021 | $3,605 | $31,870 | $6,100 | $25,770 |
| 2020 | $4,155 | $35,410 | $6,100 | $29,310 |
| 2019 | $4,314 | $35,410 | $6,100 | $29,310 |
| 2018 | $4,398 | $35,410 | $6,100 | $29,310 |
| 2017 | $4,185 | $35,410 | $6,100 | $29,310 |
| 2016 | $4,911 | $39,340 | $4,880 | $34,460 |
| 2015 | $4,241 | $35,500 | $4,880 | $30,620 |
| 2014 | -- | $35,500 | $4,880 | $30,620 |
| 2013 | -- | $22,190 | $4,880 | $17,310 |
Source: Public Records
Map
Nearby Homes