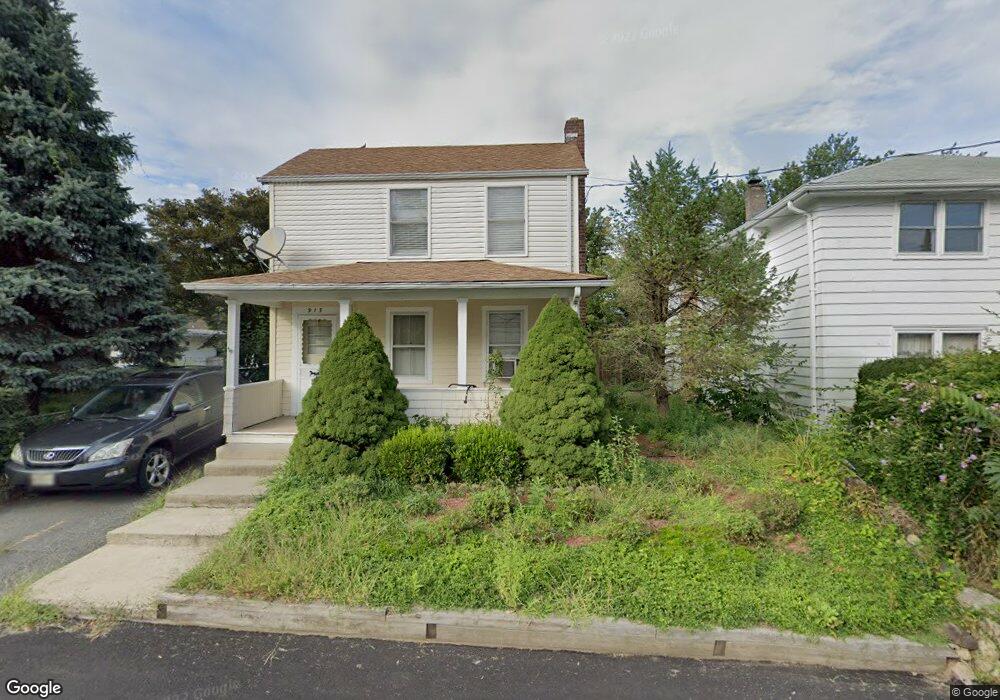
913 Cedar St Boonton, NJ 07005
Estimated Value: $408,000 - $516,000
--
Bed
--
Bath
1,080
Sq Ft
$416/Sq Ft
Est. Value
About This Home
This home is located at 913 Cedar St, Boonton, NJ 07005 and is currently estimated at $449,562, approximately $416 per square foot. 913 Cedar St is a home located in Morris County with nearby schools including School Street Elementary School, John Hill Elementary School, and Boonton High School.
Ownership History
Date
Name
Owned For
Owner Type
Purchase Details
Closed on
Mar 28, 2023
Sold by
Wong Chia-Li
Bought by
Wong Chia-Sing
Current Estimated Value
Purchase Details
Closed on
Oct 30, 2006
Sold by
Poniken Walter
Bought by
Wong Chia Li and Wong Chia Sing
Home Financials for this Owner
Home Financials are based on the most recent Mortgage that was taken out on this home.
Original Mortgage
$239,920
Interest Rate
6.33%
Mortgage Type
New Conventional
Purchase Details
Closed on
Aug 23, 2004
Sold by
Maione Christopher
Bought by
Poniken John and Poniken Ellen
Create a Home Valuation Report for This Property
The Home Valuation Report is an in-depth analysis detailing your home's value as well as a comparison with similar homes in the area
Home Values in the Area
Average Home Value in this Area
Purchase History
| Date | Buyer | Sale Price | Title Company |
|---|---|---|---|
| Wong Chia-Sing | $100,000 | None Listed On Document | |
| Wong Chia Li | $299,900 | -- | |
| Poniken John | $297,500 | -- |
Source: Public Records
Mortgage History
| Date | Status | Borrower | Loan Amount |
|---|---|---|---|
| Previous Owner | Wong Chia Li | $239,920 |
Source: Public Records
Tax History Compared to Growth
Tax History
| Year | Tax Paid | Tax Assessment Tax Assessment Total Assessment is a certain percentage of the fair market value that is determined by local assessors to be the total taxable value of land and additions on the property. | Land | Improvement |
|---|---|---|---|---|
| 2025 | $7,575 | $224,100 | $132,500 | $91,600 |
| 2024 | $7,375 | $224,100 | $132,500 | $91,600 |
| 2023 | $7,375 | $224,100 | $132,500 | $91,600 |
| 2022 | $6,990 | $224,100 | $132,500 | $91,600 |
| 2021 | $6,990 | $224,100 | $132,500 | $91,600 |
| 2020 | $6,701 | $224,100 | $132,500 | $91,600 |
| 2019 | $6,788 | $224,100 | $132,500 | $91,600 |
| 2018 | $6,609 | $224,100 | $132,500 | $91,600 |
| 2017 | $6,333 | $224,100 | $132,500 | $91,600 |
| 2016 | $6,167 | $224,100 | $132,500 | $91,600 |
| 2015 | $6,066 | $224,100 | $132,500 | $91,600 |
| 2014 | $5,932 | $224,100 | $132,500 | $91,600 |
Source: Public Records
Map
Nearby Homes