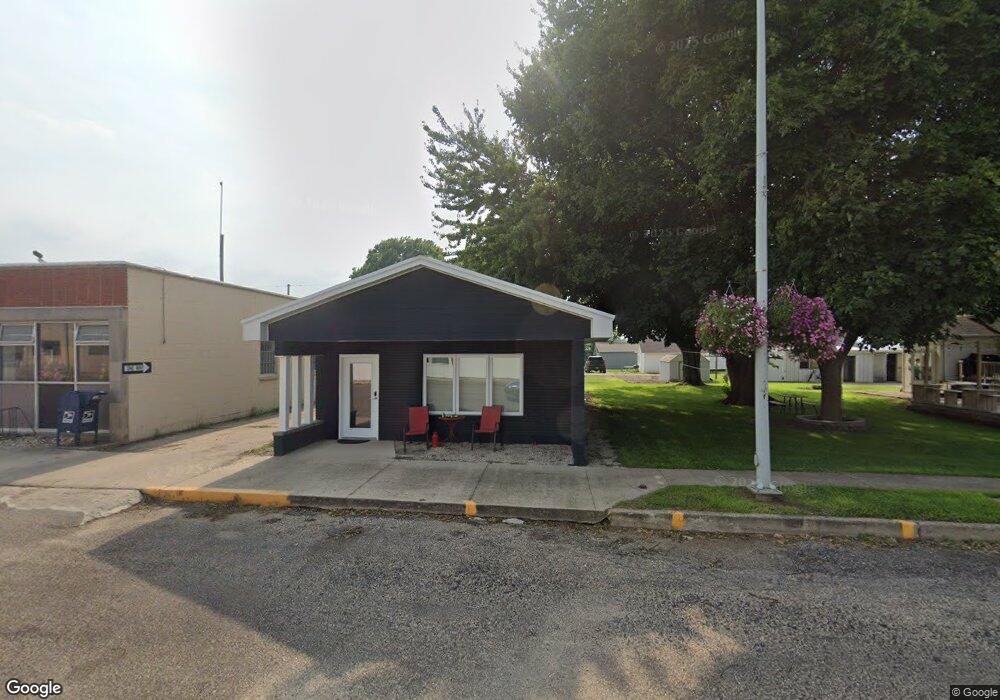
913 Main St Boyden, IA 51234
Estimated Value: $89,471 - $141,000
--
Bed
--
Bath
651
Sq Ft
$170/Sq Ft
Est. Value
About This Home
This home is located at 913 Main St, Boyden, IA 51234 and is currently estimated at $110,868, approximately $170 per square foot. 913 Main St is a home with nearby schools including Boyden-Hull Elementary School and Boyden-Hull High School.
Ownership History
Date
Name
Owned For
Owner Type
Purchase Details
Closed on
Jun 28, 2018
Sold by
Dykstra Michael M
Bought by
Faber Marille
Current Estimated Value
Home Financials for this Owner
Home Financials are based on the most recent Mortgage that was taken out on this home.
Original Mortgage
$60,300
Interest Rate
4.4%
Mortgage Type
New Conventional
Purchase Details
Closed on
May 18, 2018
Sold by
Faber Keith L and Faber Marilee
Bought by
Dykstra Michael M
Home Financials for this Owner
Home Financials are based on the most recent Mortgage that was taken out on this home.
Original Mortgage
$60,300
Interest Rate
4.4%
Mortgage Type
New Conventional
Create a Home Valuation Report for This Property
The Home Valuation Report is an in-depth analysis detailing your home's value as well as a comparison with similar homes in the area
Home Values in the Area
Average Home Value in this Area
Purchase History
| Date | Buyer | Sale Price | Title Company |
|---|---|---|---|
| Faber Marille | -- | -- | |
| Dykstra Michael M | $67,000 | -- |
Source: Public Records
Mortgage History
| Date | Status | Borrower | Loan Amount |
|---|---|---|---|
| Previous Owner | Dykstra Michael M | $60,300 |
Source: Public Records
Tax History Compared to Growth
Tax History
| Year | Tax Paid | Tax Assessment Tax Assessment Total Assessment is a certain percentage of the fair market value that is determined by local assessors to be the total taxable value of land and additions on the property. | Land | Improvement |
|---|---|---|---|---|
| 2025 | $820 | $65,220 | $1,480 | $63,740 |
| 2024 | $820 | $51,730 | $1,480 | $50,250 |
| 2023 | $806 | $51,730 | $1,480 | $50,250 |
| 2022 | $630 | $37,100 | $1,480 | $35,620 |
| 2021 | $572 | $37,170 | $1,480 | $35,690 |
| 2020 | $572 | $32,180 | $1,480 | $30,700 |
| 2019 | $458 | $24,800 | $1,480 | $23,320 |
| 2018 | $452 | $24,800 | $1,480 | $23,320 |
| 2017 | $452 | $24,800 | $1,480 | $23,320 |
| 2014 | $350 | $19,480 | $0 | $0 |
Source: Public Records
Map
Nearby Homes