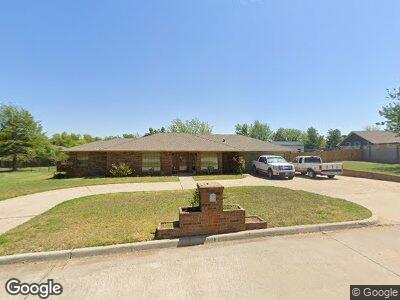
913 Mulberry Ln El Reno, OK 73036
Estimated Value: $243,000 - $280,000
4
Beds
2
Baths
1,859
Sq Ft
$142/Sq Ft
Est. Value
About This Home
This home is located at 913 Mulberry Ln, El Reno, OK 73036 and is currently estimated at $264,534, approximately $142 per square foot. 913 Mulberry Ln is a home located in Canadian County with nearby schools including Hillcrest Elementary School, Lincoln Learning Center, and Rose Witcher Elementary School.
Ownership History
Date
Name
Owned For
Owner Type
Purchase Details
Closed on
Nov 9, 2018
Sold by
Thomas David A
Bought by
Warnke Tanya and Warnke Nathan W
Current Estimated Value
Home Financials for this Owner
Home Financials are based on the most recent Mortgage that was taken out on this home.
Original Mortgage
$194,275
Outstanding Balance
$174,453
Interest Rate
4.7%
Mortgage Type
New Conventional
Purchase Details
Closed on
Jan 12, 2007
Sold by
Bostic David C and Bostic Marsha A
Bought by
Thomas David A
Home Financials for this Owner
Home Financials are based on the most recent Mortgage that was taken out on this home.
Original Mortgage
$110,000
Interest Rate
6.09%
Purchase Details
Closed on
Oct 31, 2005
Sold by
Herriman Scott
Bought by
Bostic David C and Bostic Marsha A
Home Financials for this Owner
Home Financials are based on the most recent Mortgage that was taken out on this home.
Original Mortgage
$94,400
Interest Rate
5.75%
Purchase Details
Closed on
Apr 25, 1996
Sold by
Brooks Rector M and Brooks Elsie M
Purchase Details
Closed on
May 16, 1990
Create a Home Valuation Report for This Property
The Home Valuation Report is an in-depth analysis detailing your home's value as well as a comparison with similar homes in the area
Home Values in the Area
Average Home Value in this Area
Purchase History
| Date | Buyer | Sale Price | Title Company |
|---|---|---|---|
| Warnke Tanya | $204,500 | Old Republic Title Company O | |
| Thomas David A | $119,625 | None Available | |
| Bostic David C | $88,500 | None Available | |
| -- | -- | -- | |
| -- | $83,000 | -- |
Source: Public Records
Mortgage History
| Date | Status | Borrower | Loan Amount |
|---|---|---|---|
| Open | Warnke Tanya | $194,275 | |
| Previous Owner | Thomas David A | $105,429 | |
| Previous Owner | Thomas David A | $110,000 | |
| Previous Owner | Bostic David C | $94,400 | |
| Previous Owner | Brooks Elsie M | $50,000 | |
| Previous Owner | Brooks Elsie M | $5,000 |
Source: Public Records
Tax History Compared to Growth
Tax History
| Year | Tax Paid | Tax Assessment Tax Assessment Total Assessment is a certain percentage of the fair market value that is determined by local assessors to be the total taxable value of land and additions on the property. | Land | Improvement |
|---|---|---|---|---|
| 2024 | $2,290 | $22,442 | $3,000 | $19,442 |
| 2023 | $2,290 | $21,374 | $3,000 | $18,374 |
| 2022 | $2,190 | $20,356 | $3,000 | $17,356 |
| 2021 | $2,193 | $19,903 | $3,000 | $16,903 |
| 2020 | $2,191 | $20,129 | $3,000 | $17,129 |
| 2019 | $2,259 | $19,882 | $3,000 | $16,882 |
| 2018 | $2,057 | $18,280 | $2,400 | $15,880 |
| 2017 | $2,124 | $18,508 | $2,400 | $16,108 |
| 2016 | $2,092 | $18,441 | $2,400 | $16,041 |
| 2015 | $1,990 | $17,242 | $2,400 | $14,842 |
| 2014 | $1,990 | $17,499 | $2,163 | $15,336 |
Source: Public Records
Map
Nearby Homes
- 2025 Scarlet Cir
- 1801 Golf Course Dr
- 2401 Scarlet Ln
- 2001 Crimson Creek Dr
- 1512 W Oak St
- 1505 W Shuttee St
- 1216 W Ash St
- 1240 Penny Ln
- 1312 W Shuttee St
- 1220 Strawberry Fields
- 1523 Strawberry Fields
- 1519 Strawberry Fields
- 1865 Jack Rabbit Ln
- 1517 Strawberry
- 1515 Strawberry Fields
- 1213 W Pine St
- 1840 Schooner Rd
- 1712 Settlers Crossing Blvd
- 1848 Cypress Ln
- 1858 Cypress Ln
- 913 Mulberry Ln
- 909 Mulberry Ln
- 908 Mulberry Ln
- 921 Mulberry Ln
- 906 Mulberry Ln
- 922 S Magnolia St
- 910 S Magnolia St
- 925 Mulberry Ln
- 1805 Handley Dr
- 1800 Mulberry Ln
- 906 S Magnolia St
- 1700 Crimson Lake Blvd
- 2509 Scarlet Ln
- 2505 Scarlet Ln
- 2212 Rosewood Ln
- 2321 Scarlet Ln
- 1607 Crimson Lake Blvd
- 1612 Crimson Lake Blvd
- 1613 Crimson Lake Blvd
- 1617 Crimson Lake Blvd