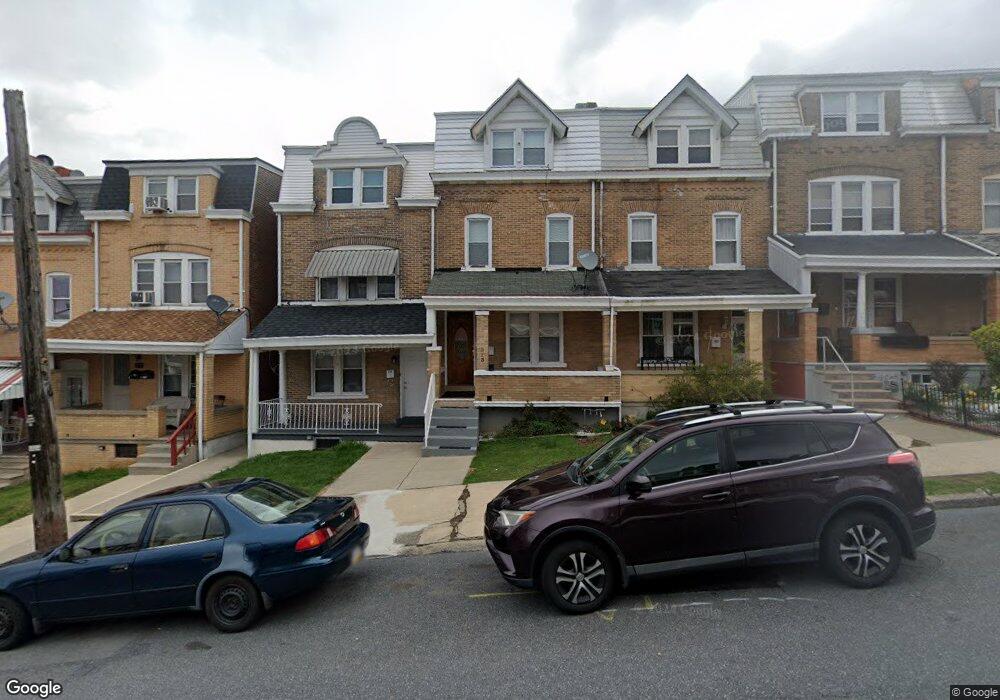
913 N 5th St Allentown, PA 18102
Center City NeighborhoodEstimated Value: $175,000 - $228,000
3
Beds
1
Bath
1,632
Sq Ft
$125/Sq Ft
Est. Value
About This Home
This home is located at 913 N 5th St, Allentown, PA 18102 and is currently estimated at $203,931, approximately $124 per square foot. 913 N 5th St is a home located in Lehigh County with nearby schools including Washington Elementary School, San Rafael Junior High School, and Trexler Middle School.
Ownership History
Date
Name
Owned For
Owner Type
Purchase Details
Closed on
Nov 19, 2004
Sold by
Kennedy Thomas E
Bought by
Moncado Alvaro
Current Estimated Value
Home Financials for this Owner
Home Financials are based on the most recent Mortgage that was taken out on this home.
Original Mortgage
$64,800
Outstanding Balance
$40,850
Interest Rate
10%
Mortgage Type
New Conventional
Estimated Equity
$163,081
Purchase Details
Closed on
Mar 31, 1982
Sold by
Jarrouj Faked
Bought by
Kennedy Thomas E
Purchase Details
Closed on
Jun 10, 1980
Bought by
Jarrouj Faked
Create a Home Valuation Report for This Property
The Home Valuation Report is an in-depth analysis detailing your home's value as well as a comparison with similar homes in the area
Home Values in the Area
Average Home Value in this Area
Purchase History
| Date | Buyer | Sale Price | Title Company |
|---|---|---|---|
| Moncado Alvaro | $81,000 | -- | |
| Kennedy Thomas E | $32,000 | -- | |
| Jarrouj Faked | -- | -- |
Source: Public Records
Mortgage History
| Date | Status | Borrower | Loan Amount |
|---|---|---|---|
| Open | Moncado Alvaro | $64,800 |
Source: Public Records
Tax History Compared to Growth
Tax History
| Year | Tax Paid | Tax Assessment Tax Assessment Total Assessment is a certain percentage of the fair market value that is determined by local assessors to be the total taxable value of land and additions on the property. | Land | Improvement |
|---|---|---|---|---|
| 2025 | $2,179 | $67,600 | $4,800 | $62,800 |
| 2024 | $2,179 | $67,600 | $4,800 | $62,800 |
| 2023 | $2,179 | $67,600 | $4,800 | $62,800 |
| 2022 | $2,102 | $67,600 | $62,800 | $4,800 |
| 2021 | $2,059 | $67,600 | $4,800 | $62,800 |
| 2020 | $2,005 | $67,600 | $4,800 | $62,800 |
| 2019 | $1,972 | $67,600 | $4,800 | $62,800 |
| 2018 | $1,843 | $67,600 | $4,800 | $62,800 |
| 2017 | $1,796 | $67,600 | $4,800 | $62,800 |
| 2016 | -- | $67,600 | $4,800 | $62,800 |
| 2015 | -- | $67,600 | $4,800 | $62,800 |
| 2014 | -- | $67,600 | $4,800 | $62,800 |
Source: Public Records
Map
Nearby Homes
- 914 N 4th St
- 833 N 5th St
- 909 N 6th St
- 824 N 5th St
- 415 W Cedar St
- 424 W Cedar St
- 614 W Greenleaf St
- 423 W Washington St
- 837 N Jordan St
- 626 W Cedar St
- 858 N 7th St
- 717 W Cedar St
- 728 W Whitehall St
- 431 Tilghman St
- 732 W Whitehall St
- 504 W Tilghman St
- 753 W Cedar St
- 643 N 4th St
- 701 N Jordan St
- 392 W Tilghman St