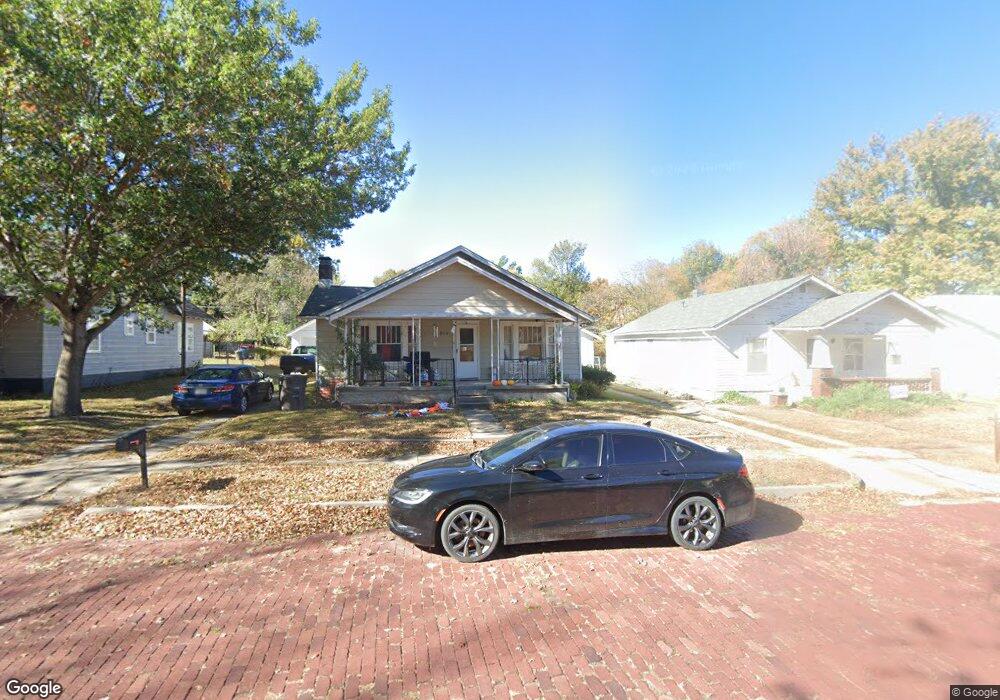
913 N B St Arkansas City, KS 67005
Estimated Value: $74,000 - $128,000
3
Beds
1
Bath
1,392
Sq Ft
$76/Sq Ft
Est. Value
About This Home
This home is located at 913 N B St, Arkansas City, KS 67005 and is currently estimated at $105,528, approximately $75 per square foot. 913 N B St is a home located in Cowley County with nearby schools including Roosevelt Elementary School, Arkansas City Middle School, and Arkansas City High School.
Ownership History
Date
Name
Owned For
Owner Type
Purchase Details
Closed on
Nov 8, 2017
Sold by
Mcpherson Westley E
Bought by
Larkin Dakota J and Larkin Cheyanne C
Current Estimated Value
Home Financials for this Owner
Home Financials are based on the most recent Mortgage that was taken out on this home.
Original Mortgage
$62,222
Outstanding Balance
$52,111
Interest Rate
3.83%
Mortgage Type
New Conventional
Estimated Equity
$53,417
Purchase Details
Closed on
Nov 30, 2006
Sold by
Traffas Richard D and Traffas Alice F
Bought by
Mcpherson Westley E and Mcpherson Amber D
Home Financials for this Owner
Home Financials are based on the most recent Mortgage that was taken out on this home.
Original Mortgage
$60,900
Interest Rate
6.3%
Create a Home Valuation Report for This Property
The Home Valuation Report is an in-depth analysis detailing your home's value as well as a comparison with similar homes in the area
Home Values in the Area
Average Home Value in this Area
Purchase History
| Date | Buyer | Sale Price | Title Company |
|---|---|---|---|
| Larkin Dakota J | -- | Security 1St Title | |
| Mcpherson Westley E | -- | -- |
Source: Public Records
Mortgage History
| Date | Status | Borrower | Loan Amount |
|---|---|---|---|
| Open | Larkin Dakota J | $62,222 | |
| Previous Owner | Mcpherson Westley E | $60,900 |
Source: Public Records
Tax History Compared to Growth
Tax History
| Year | Tax Paid | Tax Assessment Tax Assessment Total Assessment is a certain percentage of the fair market value that is determined by local assessors to be the total taxable value of land and additions on the property. | Land | Improvement |
|---|---|---|---|---|
| 2025 | $1,876 | $12,535 | $1,157 | $11,378 |
| 2024 | $1,876 | $11,500 | $1,157 | $10,343 |
| 2023 | $1,749 | $9,925 | $955 | $8,970 |
| 2022 | $1,461 | $8,556 | $917 | $7,639 |
| 2021 | $1,461 | $7,463 | $879 | $6,584 |
| 2020 | $1,435 | $7,308 | $851 | $6,457 |
| 2019 | $1,477 | $7,567 | $940 | $6,627 |
| 2018 | $1,403 | $7,245 | $589 | $6,656 |
| 2017 | $1,484 | $7,636 | $589 | $7,047 |
| 2016 | $1,453 | $7,636 | $626 | $7,010 |
| 2015 | -- | $7,636 | $626 | $7,010 |
| 2014 | -- | $6,590 | $604 | $5,986 |
Source: Public Records
Map
Nearby Homes