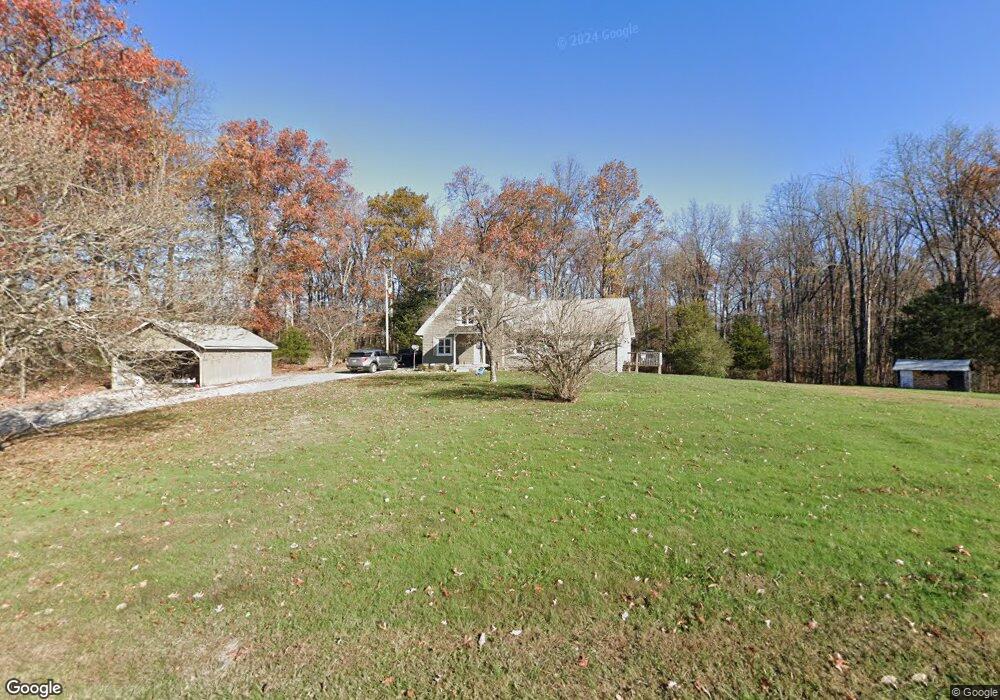
913 Providence Rd Cookeville, TN 38506
Estimated Value: $281,000 - $380,000
3
Beds
3
Baths
2,148
Sq Ft
$157/Sq Ft
Est. Value
About This Home
This home is located at 913 Providence Rd, Cookeville, TN 38506 and is currently estimated at $337,325, approximately $157 per square foot. 913 Providence Rd is a home located in Putnam County with nearby schools including Algood Middle School, Cookeville High School, and Algood Elementary School.
Ownership History
Date
Name
Owned For
Owner Type
Purchase Details
Closed on
Dec 9, 2020
Sold by
Stone Kenneth and Stone Sherri
Bought by
Stone Rental Properties Llc
Current Estimated Value
Purchase Details
Closed on
Mar 3, 2017
Sold by
Stone Kenneth
Bought by
Stone Kenneth Sherri
Purchase Details
Closed on
Oct 31, 2012
Sold by
Fowler Jason
Bought by
Stone Kenneth
Home Financials for this Owner
Home Financials are based on the most recent Mortgage that was taken out on this home.
Original Mortgage
$92,000
Interest Rate
3.4%
Mortgage Type
New Conventional
Purchase Details
Closed on
Oct 12, 2007
Bought by
Fowler Jason and Fowler Amy
Purchase Details
Closed on
Jan 9, 1990
Bought by
Weeks Jerl W and Weeks Pattie S
Purchase Details
Closed on
Jan 1, 1985
Bought by
Weeks Jerl W and Weeks Pattie S
Create a Home Valuation Report for This Property
The Home Valuation Report is an in-depth analysis detailing your home's value as well as a comparison with similar homes in the area
Home Values in the Area
Average Home Value in this Area
Purchase History
| Date | Buyer | Sale Price | Title Company |
|---|---|---|---|
| Stone Rental Properties Llc | -- | None Available | |
| Stone Kenneth Sherri | -- | -- | |
| Stone Kenneth | $115,000 | -- | |
| Fowler Jason | $136,000 | -- | |
| Weeks Jerl W | -- | -- | |
| Weeks Jerl W | $15,500 | -- |
Source: Public Records
Mortgage History
| Date | Status | Borrower | Loan Amount |
|---|---|---|---|
| Previous Owner | Stone Kenneth | $92,000 |
Source: Public Records
Tax History Compared to Growth
Tax History
| Year | Tax Paid | Tax Assessment Tax Assessment Total Assessment is a certain percentage of the fair market value that is determined by local assessors to be the total taxable value of land and additions on the property. | Land | Improvement |
|---|---|---|---|---|
| 2024 | $1,212 | $45,550 | $3,725 | $41,825 |
| 2023 | $1,212 | $45,550 | $3,725 | $41,825 |
| 2022 | $1,126 | $45,550 | $3,725 | $41,825 |
| 2021 | $817 | $45,550 | $3,725 | $41,825 |
| 2020 | $461 | $33,050 | $3,725 | $29,325 |
| 2019 | $461 | $15,750 | $3,725 | $12,025 |
| 2018 | $430 | $15,750 | $3,725 | $12,025 |
| 2017 | $430 | $15,750 | $3,725 | $12,025 |
| 2016 | $430 | $15,750 | $3,725 | $12,025 |
| 2015 | $442 | $15,750 | $3,725 | $12,025 |
| 2014 | $441 | $15,731 | $0 | $0 |
Source: Public Records
Map
Nearby Homes
- 900 Brotherton Dr
- 510 Green Springs Rd
- 34 Brotherton Dr
- 034 Brotherton Dr
- 0 Overlook Cir
- 21.40 AC Overlook Cir
- 1080 Brotherton Dr
- 4618 Plantation Ln
- Lot 183 Plantation View
- Lot 183B Plantation View
- 4626 Plantation Ln
- 361 Parragon Rd
- 430 Auguste Cir
- 0 Plantation View
- 415 Auguste Cir
- 1434 N Plantation Dr
- 411 Auguste Cir
- 167 Parragon Rd
- 1501 N Plantation Dr
- 1565 Canada Flatt Rd
- 905 Providence Rd
- 925 Providence Rd
- 850 Providence Rd
- 903 Providence Rd
- 6378 Brotherton Mountain Rd
- 901 Providence Rd
- 6363 Brotherton Mountain Rd
- 1275 Benson Rd
- 6145 Brotherton Mountain Rd
- 1382 Benson Rd
- 6960 Claude Green Rd
- 6585 Brotherton Mountain Rd
- 1172 Green Mountain Rd
- 1555 Benson Rd
- 68.45 AC Green Mountain Rd
- 5877 Brotherton Mountain Rd
- 1510 Benson Rd
- 5467 Brotherton Mountain Rd
- 1350 Green Mountain Rd
- 1643 Benson Rd