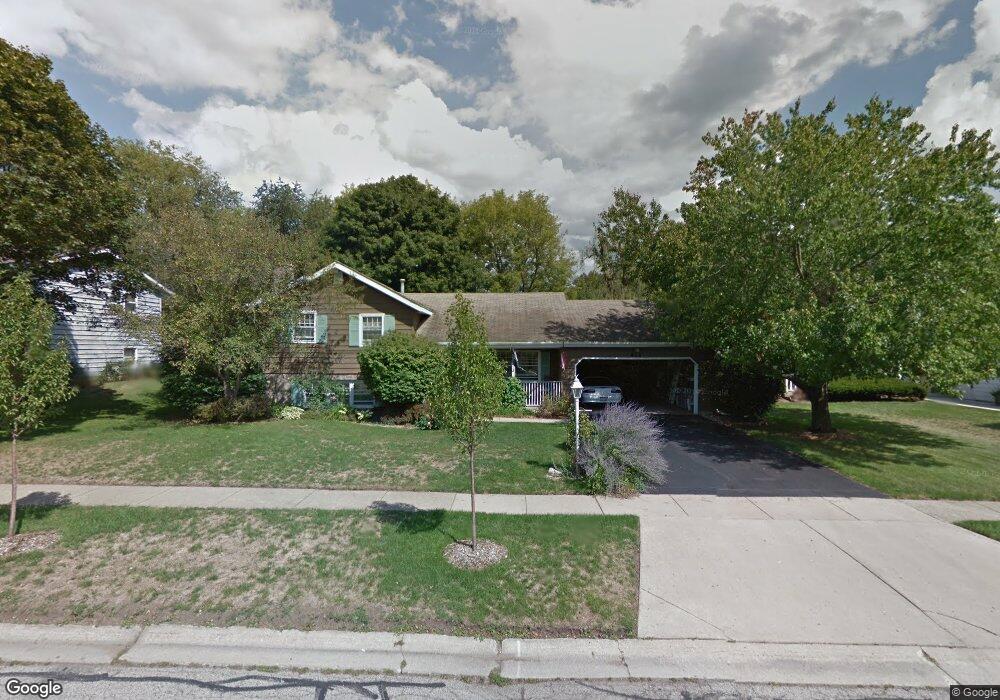
913 Scott St Algonquin, IL 60102
Estimated Value: $310,560 - $378,000
--
Bed
--
Bath
1,040
Sq Ft
$339/Sq Ft
Est. Value
About This Home
This home is located at 913 Scott St, Algonquin, IL 60102 and is currently estimated at $352,140, approximately $338 per square foot. 913 Scott St is a home located in McHenry County with nearby schools including Eastview Elementary School, Algonquin Middle School, and Dundee-Crown High School.
Ownership History
Date
Name
Owned For
Owner Type
Purchase Details
Closed on
Sep 9, 2002
Sold by
Wienke Richard A
Bought by
Wienke Richard A and Grobman Carol L
Current Estimated Value
Home Financials for this Owner
Home Financials are based on the most recent Mortgage that was taken out on this home.
Original Mortgage
$159,200
Outstanding Balance
$67,279
Interest Rate
6.4%
Estimated Equity
$284,861
Purchase Details
Closed on
Aug 30, 2002
Sold by
Ciemny James G and Ciemny Jodi
Bought by
Wienke Richard A
Home Financials for this Owner
Home Financials are based on the most recent Mortgage that was taken out on this home.
Original Mortgage
$159,200
Outstanding Balance
$67,279
Interest Rate
6.4%
Estimated Equity
$284,861
Purchase Details
Closed on
Mar 16, 2000
Sold by
Rucki Steve W and Rucki Charlotte
Bought by
Ciemny James G and Ciemny Jodi
Home Financials for this Owner
Home Financials are based on the most recent Mortgage that was taken out on this home.
Original Mortgage
$138,000
Interest Rate
8%
Create a Home Valuation Report for This Property
The Home Valuation Report is an in-depth analysis detailing your home's value as well as a comparison with similar homes in the area
Home Values in the Area
Average Home Value in this Area
Purchase History
| Date | Buyer | Sale Price | Title Company |
|---|---|---|---|
| Wienke Richard A | -- | Chicago Title Insurance Co | |
| Wienke Richard A | $199,000 | -- | |
| Ciemny James G | $177,000 | Chicago Title Insurance Co |
Source: Public Records
Mortgage History
| Date | Status | Borrower | Loan Amount |
|---|---|---|---|
| Open | Wienke Richard A | $159,200 | |
| Previous Owner | Ciemny James G | $138,000 |
Source: Public Records
Tax History Compared to Growth
Tax History
| Year | Tax Paid | Tax Assessment Tax Assessment Total Assessment is a certain percentage of the fair market value that is determined by local assessors to be the total taxable value of land and additions on the property. | Land | Improvement |
|---|---|---|---|---|
| 2024 | -- | $88,431 | $13,035 | $75,396 |
| 2023 | $4,005 | $79,090 | $11,658 | $67,432 |
| 2022 | $4,005 | $69,915 | $16,092 | $53,823 |
| 2021 | $4,005 | $65,135 | $14,992 | $50,143 |
| 2020 | $4,005 | $62,829 | $14,461 | $48,368 |
| 2019 | $0 | $60,135 | $13,841 | $46,294 |
| 2018 | $0 | $55,552 | $12,786 | $42,766 |
| 2017 | $4,005 | $52,333 | $12,045 | $40,288 |
| 2016 | $4,005 | $49,084 | $11,297 | $37,787 |
| 2013 | -- | $53,124 | $10,539 | $42,585 |
Source: Public Records
Map
Nearby Homes
- 0 Natoma Trail
- lot 25 Wabican Trail
- 1245 Winaki Trail
- 1114 Riverwood Dr Unit 1114
- 9999 Sandbloom Rd
- 2 Sunset Ln
- 1535 Teri Ln
- 400 Diamond Back Way
- 102 Center St
- 600 E Algonquin Rd
- 1715 Riverwood Dr
- 1659 E Algonquin Rd
- 1188 E Algonquin Rd
- 0 River Dr N Unit MRD12473279
- Lot 4 b Ryan Pkwy
- 1770 E Algonquin Rd
- 911 Old Oak Cir Unit 1
- 920 Plymouth Ct
- 903 Old Oak Cir
- 1561 Cumberland Pkwy
- 919 Scott St
- 920 W Vista Dr
- 930 W Vista Dr
- 925 Scott St
- 901 Scott St
- 910 W Vista Dr
- 601 S Vista Dr
- 821 Scott St Unit 9
- 902 Scott St
- 818 Scott St
- 611 S Vista Dr
- 815 Scott St
- 545 Homestead Ct
- 260 Souwanas Trail
- 915 W Vista Dr
- 830 W Vista Dr
- 605 Chelsea Dr
- 621 S Vista Dr
- 809 Scott St
- 1005 Manhatas Trail