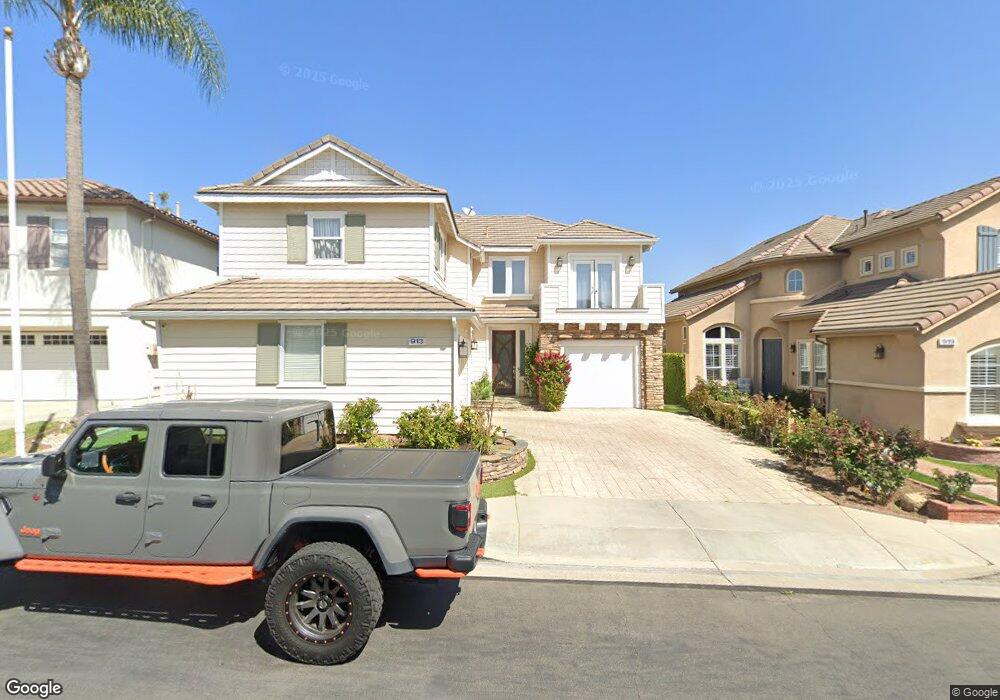
913 Torrey Pines Place Placentia, CA 92870
Estimated Value: $1,336,841 - $1,539,000
3
Beds
3
Baths
2,805
Sq Ft
$503/Sq Ft
Est. Value
About This Home
This home is located at 913 Torrey Pines Place, Placentia, CA 92870 and is currently estimated at $1,411,210, approximately $503 per square foot. 913 Torrey Pines Place is a home located in Orange County with nearby schools including John O. Tynes Elementary School, Kraemer Middle School, and Valencia High School.
Ownership History
Date
Name
Owned For
Owner Type
Purchase Details
Closed on
Oct 23, 2024
Sold by
Kahler Kipton
Bought by
Kahler Family Trust and Kahler
Current Estimated Value
Purchase Details
Closed on
Nov 25, 2017
Sold by
Kahler Nova
Bought by
Kahler Kipton
Purchase Details
Closed on
Apr 20, 2007
Sold by
Kahler Kipton and Kahler Nova Marie
Bought by
Kahler Kipton
Home Financials for this Owner
Home Financials are based on the most recent Mortgage that was taken out on this home.
Original Mortgage
$423,900
Interest Rate
6.11%
Mortgage Type
Credit Line Revolving
Purchase Details
Closed on
Aug 17, 1999
Sold by
Placentia #117 Lp
Bought by
Kahler Kipton
Home Financials for this Owner
Home Financials are based on the most recent Mortgage that was taken out on this home.
Original Mortgage
$364,980
Interest Rate
7%
Create a Home Valuation Report for This Property
The Home Valuation Report is an in-depth analysis detailing your home's value as well as a comparison with similar homes in the area
Home Values in the Area
Average Home Value in this Area
Purchase History
| Date | Buyer | Sale Price | Title Company |
|---|---|---|---|
| Kahler Family Trust | -- | None Listed On Document | |
| Kahler Kipton | -- | First American Title Co | |
| Kahler Kipton | -- | None Available | |
| Kahler Kipton | $456,500 | First American Title Ins Co |
Source: Public Records
Mortgage History
| Date | Status | Borrower | Loan Amount |
|---|---|---|---|
| Previous Owner | Kahler Kipton | $423,900 | |
| Previous Owner | Kahler Kipton | $364,980 |
Source: Public Records
Tax History Compared to Growth
Tax History
| Year | Tax Paid | Tax Assessment Tax Assessment Total Assessment is a certain percentage of the fair market value that is determined by local assessors to be the total taxable value of land and additions on the property. | Land | Improvement |
|---|---|---|---|---|
| 2025 | $8,525 | $721,191 | $224,104 | $497,087 |
| 2024 | $8,525 | $707,050 | $219,709 | $487,341 |
| 2023 | $8,356 | $693,187 | $215,401 | $477,786 |
| 2022 | $8,248 | $679,596 | $211,178 | $468,418 |
| 2021 | $8,064 | $666,271 | $207,037 | $459,234 |
| 2020 | $8,089 | $659,440 | $204,914 | $454,526 |
| 2019 | $7,777 | $646,510 | $200,896 | $445,614 |
| 2018 | $7,680 | $633,834 | $196,957 | $436,877 |
| 2017 | $7,554 | $621,406 | $193,095 | $428,311 |
| 2016 | $7,406 | $609,222 | $189,309 | $419,913 |
| 2015 | $7,314 | $600,071 | $186,465 | $413,606 |
| 2014 | $7,108 | $588,317 | $182,812 | $405,505 |
Source: Public Records
Map
Nearby Homes
- 988 Spyglass Place
- 747 De Jesus Dr
- 1037 Davis Way
- 615 Jensen Place
- 1142 Soto Place
- 549 Fordham Dr
- 1171 Curie Ln
- 1018 Violet Cir
- 1259 E Providence Loop
- 921 Azalea Ave
- 625 Patten Ave
- Elina Plan at Vista Rose
- Lyda Plan at Vista Rose
- Prairie Plan at Vista Rose
- Gallica Plan at Vista Rose
- 653 Patten Ave
- 707 Olivier Dr
- 582 Mcfadden St
- 704 Mcfadden St
- 714 Olivier Dr
- 907 Torrey Pines Place
- 919 Torrey Pines Place
- 925 Torrey Pines Place
- 901 Torrey Pines Place
- 914 Torrey Pines Place
- 920 Torrey Pines Place
- 926 Torrey Pines Place
- 931 Torrey Pines Place
- 904 Spyglass Place
- 910 Spyglass Place
- 932 Torrey Pines Place
- 935 Spyglass Place
- 937 Torrey Pines Place
- 916 Spyglass Place
- 423 Quail Run Ln
- 922 Spyglass Place
- 943 Torrey Pines Place
- 941 Spyglass Place
- 436 Quail Run Ln
- 928 Spyglass Place