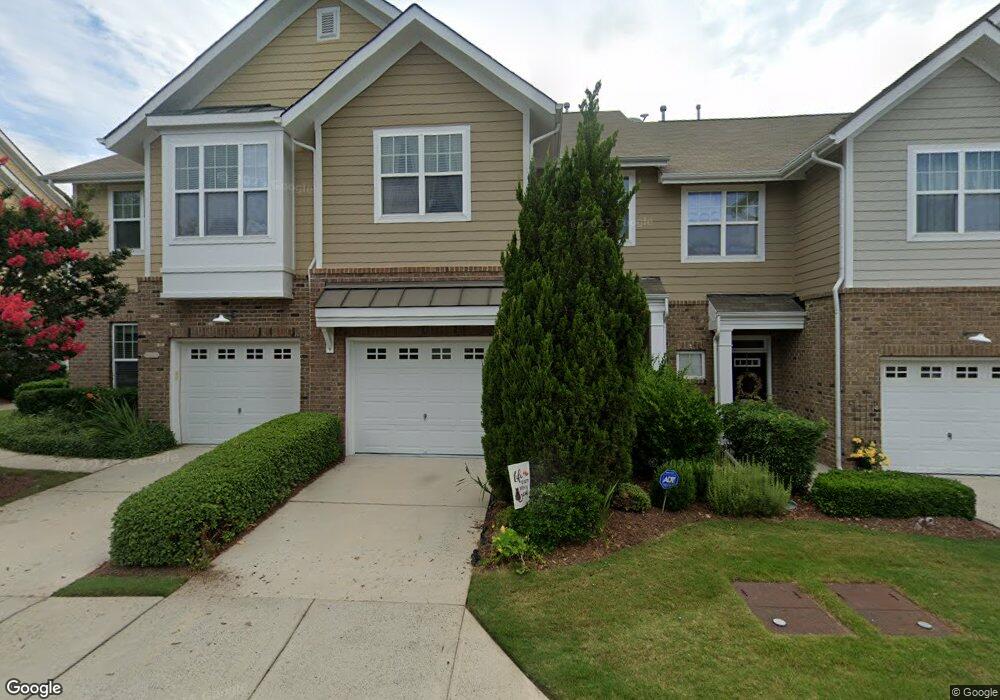
9132 Bunnwood Ln Raleigh, NC 27617
Brier Creek NeighborhoodEstimated Value: $385,775 - $401,000
3
Beds
3
Baths
1,665
Sq Ft
$237/Sq Ft
Est. Value
About This Home
This home is located at 9132 Bunnwood Ln, Raleigh, NC 27617 and is currently estimated at $394,694, approximately $237 per square foot. 9132 Bunnwood Ln is a home located in Wake County with nearby schools including Brier Creek Elementary School, Pine Hollow Middle School, and Leesville Road High School.
Ownership History
Date
Name
Owned For
Owner Type
Purchase Details
Closed on
Jul 6, 2017
Sold by
Shaw Angela and Cain Angela Shaw
Bought by
Heitmann Marlies
Current Estimated Value
Home Financials for this Owner
Home Financials are based on the most recent Mortgage that was taken out on this home.
Original Mortgage
$151,000
Outstanding Balance
$125,524
Interest Rate
3.91%
Mortgage Type
New Conventional
Estimated Equity
$269,170
Purchase Details
Closed on
Jun 16, 2014
Sold by
Ware Brian C and Crouch Christen M
Bought by
Shaw Cain Angela
Home Financials for this Owner
Home Financials are based on the most recent Mortgage that was taken out on this home.
Original Mortgage
$215,000
Interest Rate
4.5%
Mortgage Type
Adjustable Rate Mortgage/ARM
Purchase Details
Closed on
Oct 8, 2008
Sold by
Standard Pacific Of The Carolinas Llc
Bought by
Ware Brian C and Crouch Christen M
Home Financials for this Owner
Home Financials are based on the most recent Mortgage that was taken out on this home.
Original Mortgage
$212,421
Interest Rate
6.36%
Mortgage Type
FHA
Create a Home Valuation Report for This Property
The Home Valuation Report is an in-depth analysis detailing your home's value as well as a comparison with similar homes in the area
Home Values in the Area
Average Home Value in this Area
Purchase History
| Date | Buyer | Sale Price | Title Company |
|---|---|---|---|
| Heitmann Marlies | $251,500 | None Available | |
| Shaw Cain Angela | $215,000 | None Available | |
| Ware Brian C | $216,000 | None Available |
Source: Public Records
Mortgage History
| Date | Status | Borrower | Loan Amount |
|---|---|---|---|
| Open | Heitmann Marlies | $151,000 | |
| Previous Owner | Shaw Cain Angela | $215,000 | |
| Previous Owner | Ware Brian C | $212,421 |
Source: Public Records
Tax History Compared to Growth
Tax History
| Year | Tax Paid | Tax Assessment Tax Assessment Total Assessment is a certain percentage of the fair market value that is determined by local assessors to be the total taxable value of land and additions on the property. | Land | Improvement |
|---|---|---|---|---|
| 2025 | $3,435 | $391,558 | $85,000 | $306,558 |
| 2024 | $3,421 | $391,558 | $85,000 | $306,558 |
| 2023 | $3,079 | $280,598 | $60,000 | $220,598 |
| 2022 | $2,861 | $280,598 | $60,000 | $220,598 |
| 2021 | $2,750 | $280,598 | $60,000 | $220,598 |
| 2020 | $2,700 | $280,598 | $60,000 | $220,598 |
| 2019 | $2,704 | $231,569 | $56,000 | $175,569 |
| 2018 | $2,550 | $231,569 | $56,000 | $175,569 |
| 2017 | $2,429 | $231,569 | $56,000 | $175,569 |
| 2016 | $2,379 | $231,569 | $56,000 | $175,569 |
| 2015 | $2,346 | $224,638 | $50,000 | $174,638 |
| 2014 | $2,226 | $224,638 | $50,000 | $174,638 |
Source: Public Records
Map
Nearby Homes
- 9120 Bunnwood Ln
- 9104 Wooden Rd
- 9201 Wooden Rd
- 9207 Wooden Rd
- 9206 Wooden Rd
- 9202 Giralda Walk
- 9221 Calabria Dr Unit 105
- 9211 Calabria Dr Unit 104
- 9211 Calabria Dr Unit 117
- 10119 Glen Autumn Rd
- 9302 Alcazar Walk
- 9327 Falkwood Rd
- 10510 Sablewood Dr Unit 116
- 10510 Sablewood Dr Unit 206
- 10511 Sablewood Dr Unit 107
- 10410 Sablewood Dr Unit 109
- 9328 Wooden Rd
- 10321 Sablewood Dr Unit 108
- 10321 Sablewood Dr Unit 107
- 9340 Wooden Rd
- 9130 Bunnwood Ln
- 9134 Bunnwood Ln
- 9128 Bunnwood Ln
- 9138 Bunnwood Ln
- 9126 Bunnwood Ln
- 9124 Bunnwood Ln
- 9140 Bunnwood Ln
- 9122 Bunnwood Ln
- 9142 Bunnwood Ln
- 9133 Bunnwood Ln
- 9135 Bunnwood Ln
- 9131 Bunnwood Ln
- 9129 Bunnwood Ln
- 9144 Bunnwood Ln
- 9139 Bunnwood Ln
- 9127 Bunnwood Ln
- 9146 Bunnwood Ln
- 9141 Bunnwood Ln
- 9125 Bunnwood Ln
- 9143 Bunnwood Ln