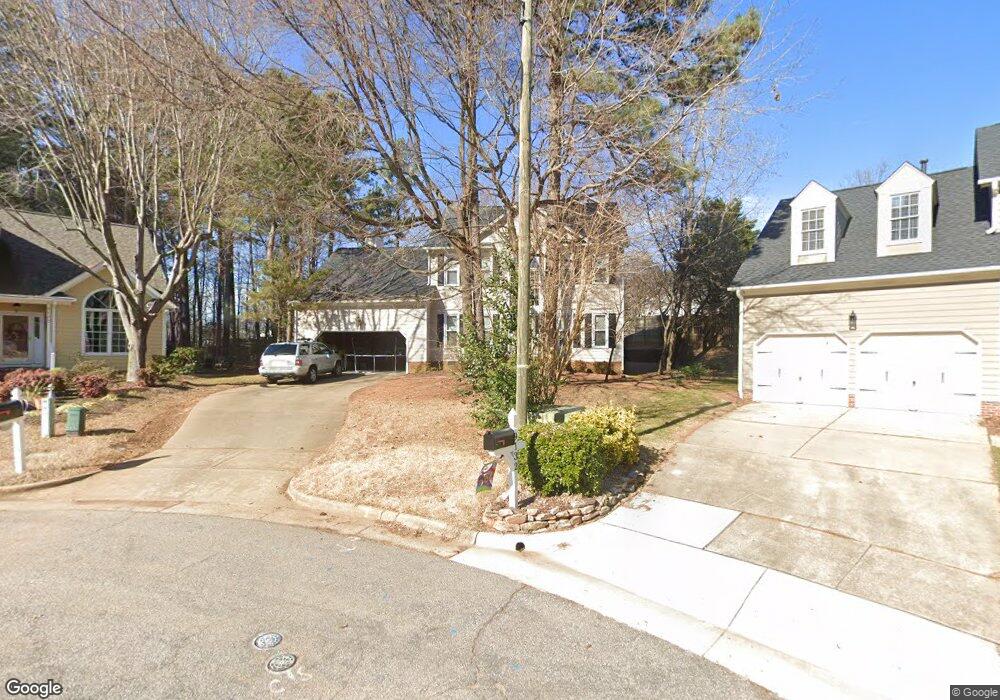
9136 W Doublebit Dr Raleigh, NC 27615
Durant NeighborhoodEstimated Value: $514,698 - $540,000
4
Beds
3
Baths
2,275
Sq Ft
$232/Sq Ft
Est. Value
About This Home
This home is located at 9136 W Doublebit Dr, Raleigh, NC 27615 and is currently estimated at $526,925, approximately $231 per square foot. 9136 W Doublebit Dr is a home located in Wake County with nearby schools including Durant Road Elementary, Durant Road Middle, and Millbrook High School.
Ownership History
Date
Name
Owned For
Owner Type
Purchase Details
Closed on
Oct 31, 2007
Sold by
Goforth Christy A and Goforth Trent C
Bought by
Tangari Frank and Aksu Tangari Banu
Current Estimated Value
Home Financials for this Owner
Home Financials are based on the most recent Mortgage that was taken out on this home.
Original Mortgage
$193,600
Outstanding Balance
$121,795
Interest Rate
6.27%
Mortgage Type
Purchase Money Mortgage
Estimated Equity
$405,130
Purchase Details
Closed on
Sep 20, 2005
Sold by
Brosseau Donald E and Brosseau Patricia
Bought by
Costner Christy A
Home Financials for this Owner
Home Financials are based on the most recent Mortgage that was taken out on this home.
Original Mortgage
$192,000
Interest Rate
5.77%
Mortgage Type
Fannie Mae Freddie Mac
Create a Home Valuation Report for This Property
The Home Valuation Report is an in-depth analysis detailing your home's value as well as a comparison with similar homes in the area
Home Values in the Area
Average Home Value in this Area
Purchase History
| Date | Buyer | Sale Price | Title Company |
|---|---|---|---|
| Tangari Frank | $242,000 | None Available | |
| Costner Christy A | $240,000 | None Available |
Source: Public Records
Mortgage History
| Date | Status | Borrower | Loan Amount |
|---|---|---|---|
| Open | Tangari Frank | $193,600 | |
| Previous Owner | Costner Christy A | $192,000 | |
| Previous Owner | Costner Christy A | $36,000 |
Source: Public Records
Tax History Compared to Growth
Tax History
| Year | Tax Paid | Tax Assessment Tax Assessment Total Assessment is a certain percentage of the fair market value that is determined by local assessors to be the total taxable value of land and additions on the property. | Land | Improvement |
|---|---|---|---|---|
| 2025 | $4,547 | $519,047 | $135,000 | $384,047 |
| 2024 | $4,528 | $519,047 | $135,000 | $384,047 |
| 2023 | $3,654 | $333,427 | $65,000 | $268,427 |
| 2022 | $3,396 | $333,427 | $65,000 | $268,427 |
| 2021 | $3,256 | $333,427 | $65,000 | $268,427 |
| 2020 | $3,117 | $324,272 | $65,000 | $259,272 |
| 2019 | $3,150 | $270,058 | $67,000 | $203,058 |
| 2018 | $2,971 | $270,058 | $67,000 | $203,058 |
| 2017 | $2,829 | $270,058 | $67,000 | $203,058 |
| 2016 | $2,200 | $270,058 | $67,000 | $203,058 |
| 2015 | $1,646 | $262,989 | $62,000 | $200,989 |
| 2014 | $1,440 | $262,989 | $62,000 | $200,989 |
Source: Public Records
Map
Nearby Homes
- 9101 Jackknife Trail
- 9013 Tenderfoot Trail
- 9012 Walking Stick Trail
- 9512 Anson Grove Ln
- 8913 Walking Stick Trail
- 3212 Loyal Ln
- 11001 Louson Place
- 9205 Dawnshire Rd
- 11020 Southwalk Ln
- 8600 Clivedon Dr
- 1301 Durlain Dr Unit 103
- 1310 Durlain Dr Unit 103
- 8730 Courage Ct
- 2324 Dahlgreen Rd
- 10205 Sorrills Creek Ln
- 8700 Den Ct
- 1741 Farmington Grove Dr
- 2408 Deanwood Dr
- 10506 Pleasant Branch Dr Unit Lot 38
- 8825 Kirkstall Ct
- 9137 W Doublebit Dr
- 9132 W Doublebit Dr
- 9128 W Doublebit Dr
- 9133 W Doublebit Dr
- 9129 W Doublebit Dr
- 9124 W Doublebit Dr
- 9125 W Doublebit Dr
- 10300 Durant Rd
- 9116 Walking Stick Trail
- 9120 W Doublebit Dr
- 9112 Walking Stick Trail
- 10224 Durant Rd
- 9117 W Doublebit Dr
- 9116 W Doublebit Dr
- 9113 Walking Stick Trail
- 9108 Walking Stick Trail
- 9109 W Doublebit Dr
- 9112 W Doublebit Dr
- 10320 Durant Rd
- 9104 Walking Stick Trail