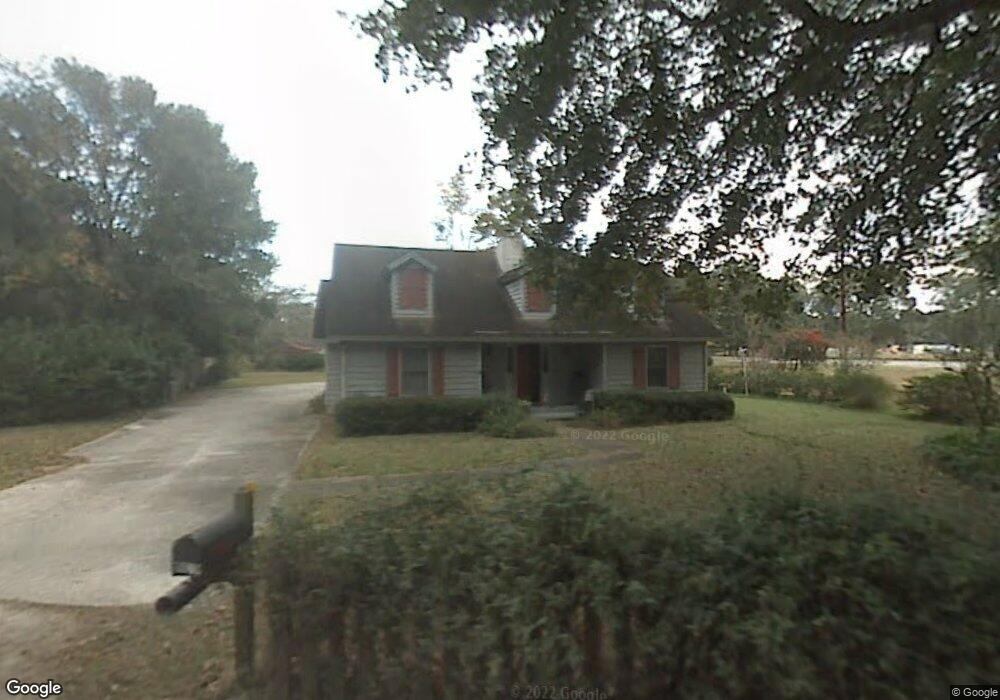
9139 Creekwood Rd Savannah, GA 31406
Cresthill NeighborhoodEstimated Value: $291,894 - $371,000
3
Beds
2
Baths
1,746
Sq Ft
$196/Sq Ft
Est. Value
About This Home
This home is located at 9139 Creekwood Rd, Savannah, GA 31406 and is currently estimated at $342,224, approximately $196 per square foot. 9139 Creekwood Rd is a home located in Chatham County with nearby schools including Hesse School, Jenkins High School, and Oglethorpe Charter School.
Ownership History
Date
Name
Owned For
Owner Type
Purchase Details
Closed on
Nov 26, 2018
Sold by
Moore Lindy Ray
Bought by
Moore Lindy Ray and Moore Debra U
Current Estimated Value
Purchase Details
Closed on
Feb 20, 2015
Sold by
Moore Lindy Ray
Bought by
Moore Lindy Ray and Moore Janie H
Create a Home Valuation Report for This Property
The Home Valuation Report is an in-depth analysis detailing your home's value as well as a comparison with similar homes in the area
Home Values in the Area
Average Home Value in this Area
Purchase History
| Date | Buyer | Sale Price | Title Company |
|---|---|---|---|
| Moore Lindy Ray | -- | -- | |
| Moore Lindy Ray | -- | -- |
Source: Public Records
Tax History Compared to Growth
Tax History
| Year | Tax Paid | Tax Assessment Tax Assessment Total Assessment is a certain percentage of the fair market value that is determined by local assessors to be the total taxable value of land and additions on the property. | Land | Improvement |
|---|---|---|---|---|
| 2025 | $574 | $67,040 | $14,800 | $52,240 |
| 2024 | $574 | $68,160 | $14,800 | $53,360 |
| 2023 | $574 | $73,520 | $14,800 | $58,720 |
| 2022 | $2,037 | $67,800 | $14,800 | $53,000 |
| 2021 | $2,098 | $64,520 | $14,800 | $49,720 |
| 2020 | $2,090 | $64,520 | $14,800 | $49,720 |
| 2019 | $2,175 | $64,520 | $14,800 | $49,720 |
| 2018 | $1,953 | $63,640 | $14,800 | $48,840 |
| 2017 | $1,680 | $64,880 | $14,800 | $50,080 |
| 2016 | $1,723 | $50,440 | $14,800 | $35,640 |
| 2015 | $471 | $51,360 | $14,600 | $36,760 |
| 2014 | $650 | $51,200 | $0 | $0 |
Source: Public Records
Map
Nearby Homes
- 9233 Garland Dr
- 109 Kings Ct
- 105 Kings Ct
- 1602 Kings Way
- 1411 Blakeley Rd
- 6 Prince Charles Ct
- 9121 Garland Dr
- 1345 Lavon Ave
- 1 Patron Ct
- 8813 Whitefield Ave
- 1614 Hendry Ave
- 822 Dancy Ave
- 8623 W Creighton Place
- 606 Rivers End Dr
- 844 Dancy Ave
- 8518 Whitefield Ave
- 8519 Cresthill Ave
- 8708 Clarke Ave
- 105 Harmon Creek Dr
- 8516 Vining Way
- 9137 Whitefield Ave
- 1213 Levant Dr
- 9145 Creekwood Rd
- 9141 Creekwood Rd
- 9135 Whitefield Ave
- 1215 Levant Dr
- 1210 Levant Dr
- 1212 Levant Dr
- 9133 Whitefield Ave
- 8 Quail Trail
- 10 Quail St
- 6 Quail Trail
- 10 Quail Trail
- 1216 Levant Dr
- 12 Quail Trail
- 12 Quail St
- 9131 Whitefield Ave
- 1221 Beckman Ave
- 9161 Creekwood Rd
- 1223 Beckman Ave