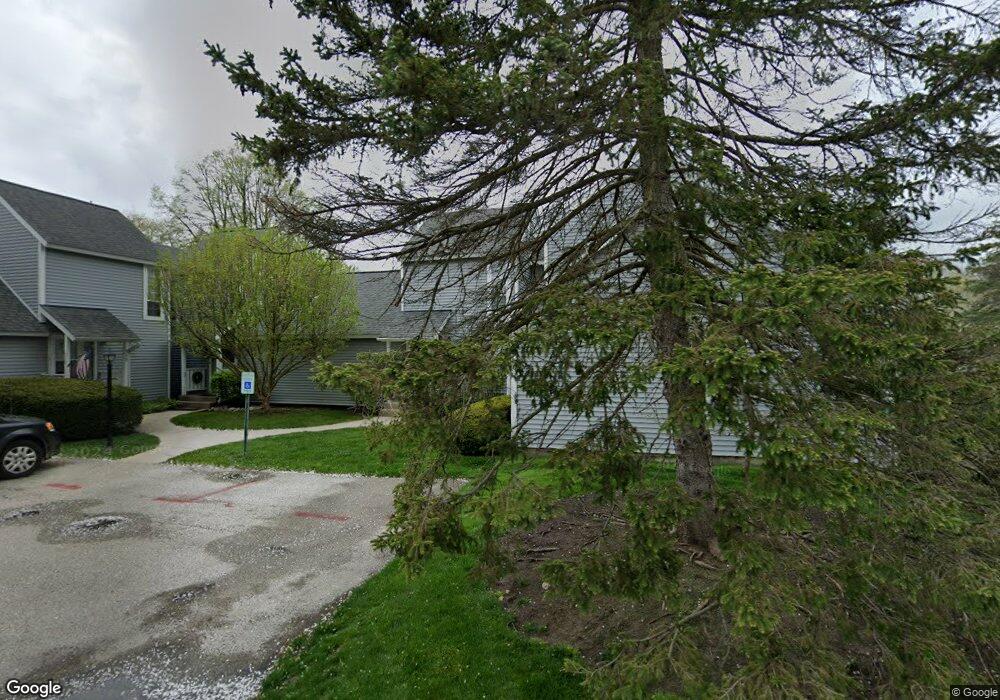
914 Campbell Dr Unit U493 Gurnee, IL 60031
Estimated Value: $209,440 - $223,000
2
Beds
2
Baths
1,162
Sq Ft
$186/Sq Ft
Est. Value
About This Home
This home is located at 914 Campbell Dr Unit U493, Gurnee, IL 60031 and is currently estimated at $216,360, approximately $186 per square foot. 914 Campbell Dr Unit U493 is a home located in Lake County with nearby schools including Woodland Primary School, Woodland Elementary School, and Woodland Intermediate School.
Ownership History
Date
Name
Owned For
Owner Type
Purchase Details
Closed on
Dec 3, 2001
Sold by
Hagen Chester E
Bought by
Merriman Bradley C
Current Estimated Value
Home Financials for this Owner
Home Financials are based on the most recent Mortgage that was taken out on this home.
Original Mortgage
$107,000
Interest Rate
6.52%
Mortgage Type
Balloon
Purchase Details
Closed on
Dec 22, 1995
Sold by
Delgado Christopher and Alsens Karl S
Bought by
Hagen Chester E
Home Financials for this Owner
Home Financials are based on the most recent Mortgage that was taken out on this home.
Original Mortgage
$79,200
Interest Rate
7.24%
Create a Home Valuation Report for This Property
The Home Valuation Report is an in-depth analysis detailing your home's value as well as a comparison with similar homes in the area
Home Values in the Area
Average Home Value in this Area
Purchase History
| Date | Buyer | Sale Price | Title Company |
|---|---|---|---|
| Merriman Bradley C | $119,000 | -- | |
| Hagen Chester E | $88,000 | Attorneys Natl Title Network |
Source: Public Records
Mortgage History
| Date | Status | Borrower | Loan Amount |
|---|---|---|---|
| Closed | Merriman Bradley C | $107,000 | |
| Previous Owner | Hagen Chester E | $79,200 |
Source: Public Records
Tax History Compared to Growth
Tax History
| Year | Tax Paid | Tax Assessment Tax Assessment Total Assessment is a certain percentage of the fair market value that is determined by local assessors to be the total taxable value of land and additions on the property. | Land | Improvement |
|---|---|---|---|---|
| 2024 | $4,636 | $57,810 | $8,185 | $49,625 |
| 2023 | $3,851 | $53,672 | $7,599 | $46,073 |
| 2022 | $3,851 | $45,511 | $5,929 | $39,582 |
| 2021 | $3,239 | $41,212 | $5,369 | $35,843 |
| 2020 | $3,126 | $40,199 | $5,237 | $34,962 |
| 2019 | $3,031 | $39,032 | $5,085 | $33,947 |
| 2018 | $2,474 | $33,409 | $2,676 | $30,733 |
| 2017 | $2,442 | $32,451 | $2,599 | $29,852 |
| 2016 | $2,404 | $31,006 | $2,483 | $28,523 |
| 2015 | $2,319 | $29,406 | $2,355 | $27,051 |
| 2014 | $2,155 | $27,872 | $2,323 | $25,549 |
| 2012 | $3,152 | $28,086 | $2,341 | $25,745 |
Source: Public Records
Map
Nearby Homes
- 920 Vose Dr Unit 202
- 920 Vose Dr Unit 106
- 920 Vose Dr Unit 208
- 740 Chandler Rd Unit U85
- 706 Owl Creek Ln
- 690 Chandler Rd Unit 302
- 690 Chandler Rd Unit 207
- 650 Whitney Ct Unit 203
- 650 Whitney Ct Unit 108
- 651 White Ct
- 6296 Doral Dr
- 17603 W Windslow Dr
- 17613 W Meadowbrook Dr
- 6183 Old Farm Ln Unit 3
- 34026 N White Oak Ln Unit 48C
- 34110 N White Oak Ln Unit 37B
- 17914 W Twin Lakes Blvd
- 33485 N Mill Rd
- 17954 W Big Oaks Rd
- 17298 W Maple Ln
- 916 Campbell Dr Unit U494
- 912 Campbell Dr
- 910 Campbell Dr Unit U491
- 908 Campbell Dr Unit U490
- 909 Campbell Dr
- 906 Campbell Dr Unit U489
- 913 Campbell Dr Unit U486
- 843 Bingham Ct
- 839 Bingham Ct
- 905 Campbell Dr
- 911 Campbell Dr Unit 484
- 915 Campbell Dr Unit U483
- 904 Campbell Dr Unit U488
- 6094 Newbury Ct
- 907 Campbell Dr Unit U479
- 6098 Newbury Ct
- 901 Campbell Dr Unit 481
- 902 Campbell Dr
- 6101 Newbury Ct
- 903 Campbell Dr Unit U480