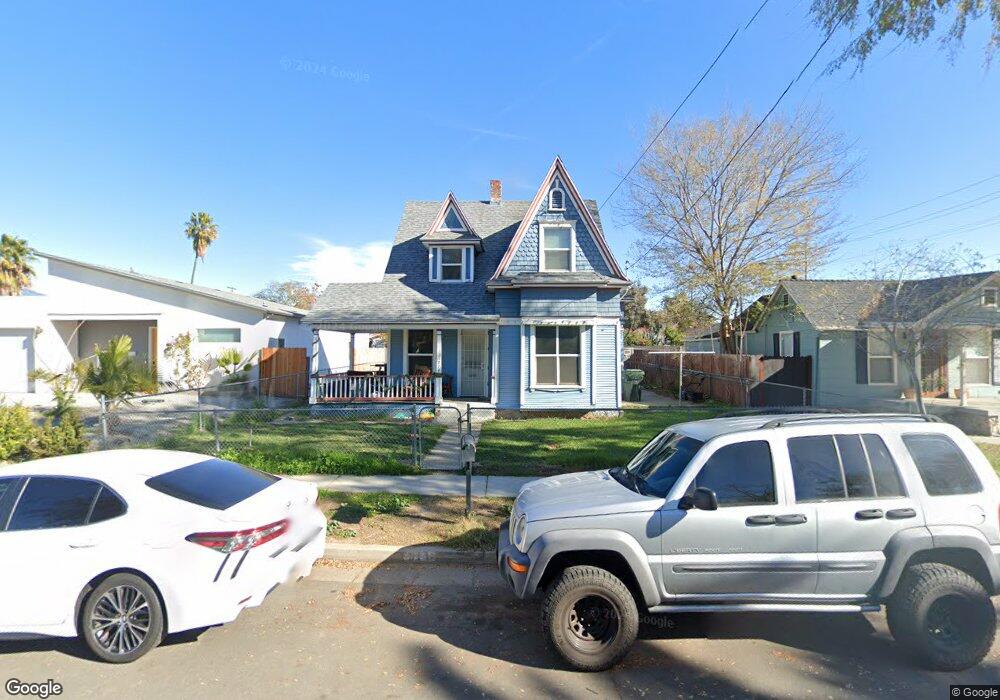
914 Lawton St Redlands, CA 92374
North Redlands NeighborhoodEstimated Value: $440,646 - $532,000
5
Beds
1
Bath
1,224
Sq Ft
$402/Sq Ft
Est. Value
About This Home
This home is located at 914 Lawton St, Redlands, CA 92374 and is currently estimated at $491,912, approximately $401 per square foot. 914 Lawton St is a home located in San Bernardino County with nearby schools including Kimberly Elementary School, Moore Middle School, and Redlands East Valley High School.
Ownership History
Date
Name
Owned For
Owner Type
Purchase Details
Closed on
Nov 11, 2020
Sold by
Manuel Raymond A and Manuel Raymond Allen
Bought by
Manuel Raymond Allen and The Raymond Allen Manuel Livin
Current Estimated Value
Purchase Details
Closed on
May 18, 2011
Sold by
Dci Investments Llc
Bought by
Manuel Raymond A
Home Financials for this Owner
Home Financials are based on the most recent Mortgage that was taken out on this home.
Original Mortgage
$163,337
Outstanding Balance
$113,302
Interest Rate
4.84%
Mortgage Type
VA
Estimated Equity
$378,610
Purchase Details
Closed on
Jul 21, 2010
Sold by
Sepulveda Martha E
Bought by
Dci Investments Llc
Create a Home Valuation Report for This Property
The Home Valuation Report is an in-depth analysis detailing your home's value as well as a comparison with similar homes in the area
Home Values in the Area
Average Home Value in this Area
Purchase History
| Date | Buyer | Sale Price | Title Company |
|---|---|---|---|
| Manuel Raymond Allen | -- | None Available | |
| Manuel Raymond A | $160,000 | Netco Title Company | |
| Dci Investments Llc | $88,500 | Priority Title |
Source: Public Records
Mortgage History
| Date | Status | Borrower | Loan Amount |
|---|---|---|---|
| Open | Manuel Raymond A | $163,337 |
Source: Public Records
Tax History Compared to Growth
Tax History
| Year | Tax Paid | Tax Assessment Tax Assessment Total Assessment is a certain percentage of the fair market value that is determined by local assessors to be the total taxable value of land and additions on the property. | Land | Improvement |
|---|---|---|---|---|
| 2025 | $2,405 | $204,859 | $32,029 | $172,830 |
| 2024 | $2,405 | $200,842 | $31,401 | $169,441 |
| 2023 | $2,402 | $196,904 | $30,785 | $166,119 |
| 2022 | $2,368 | $193,043 | $30,181 | $162,862 |
| 2021 | $2,411 | $189,258 | $29,589 | $159,669 |
| 2020 | $2,375 | $187,318 | $29,286 | $158,032 |
| 2019 | $2,309 | $183,645 | $28,712 | $154,933 |
| 2018 | $2,252 | $180,044 | $28,149 | $151,895 |
| 2017 | $2,233 | $176,514 | $27,597 | $148,917 |
| 2016 | $2,209 | $173,053 | $27,056 | $145,997 |
| 2015 | $2,192 | $170,454 | $26,650 | $143,804 |
| 2014 | $2,153 | $167,115 | $26,128 | $140,987 |
Source: Public Records
Map
Nearby Homes