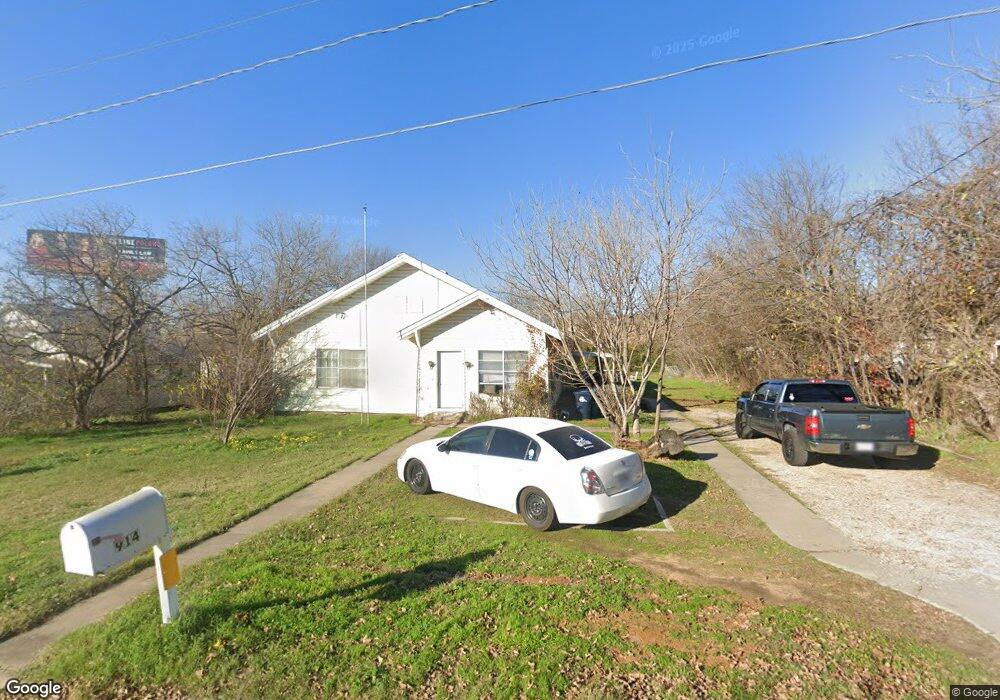
914 Lindsey St Denton, TX 76201
South Denton NeighborhoodEstimated Value: $297,000 - $365,365
3
Beds
1
Bath
1,900
Sq Ft
$175/Sq Ft
Est. Value
About This Home
This home is located at 914 Lindsey St, Denton, TX 76201 and is currently estimated at $331,841, approximately $174 per square foot. 914 Lindsey St is a home located in Denton County with nearby schools including Borman Elementary School, Calhoun Middle School, and Denton High School.
Ownership History
Date
Name
Owned For
Owner Type
Purchase Details
Closed on
Feb 24, 2021
Sold by
Davenport William David
Bought by
Dx4 Holdings Llc
Current Estimated Value
Purchase Details
Closed on
Jun 12, 2015
Sold by
Allen Laurie D and Fox Charline Jones
Bought by
Davenport William David
Home Financials for this Owner
Home Financials are based on the most recent Mortgage that was taken out on this home.
Original Mortgage
$140,000
Interest Rate
3.7%
Mortgage Type
Purchase Money Mortgage
Purchase Details
Closed on
Jul 1, 2010
Sold by
Cox Charline Jones and Cox Ina Charlene
Bought by
Cox Charline Jones
Home Financials for this Owner
Home Financials are based on the most recent Mortgage that was taken out on this home.
Original Mortgage
$195,000
Interest Rate
2.34%
Mortgage Type
Reverse Mortgage Home Equity Conversion Mortgage
Create a Home Valuation Report for This Property
The Home Valuation Report is an in-depth analysis detailing your home's value as well as a comparison with similar homes in the area
Home Values in the Area
Average Home Value in this Area
Purchase History
| Date | Buyer | Sale Price | Title Company |
|---|---|---|---|
| Dx4 Holdings Llc | -- | None Listed On Document | |
| Davenport William David | -- | Title Resources | |
| Cox Charline Jones | -- | None Available |
Source: Public Records
Mortgage History
| Date | Status | Borrower | Loan Amount |
|---|---|---|---|
| Previous Owner | Davenport William David | $140,000 | |
| Previous Owner | Cox Charline Jones | $195,000 |
Source: Public Records
Tax History Compared to Growth
Tax History
| Year | Tax Paid | Tax Assessment Tax Assessment Total Assessment is a certain percentage of the fair market value that is determined by local assessors to be the total taxable value of land and additions on the property. | Land | Improvement |
|---|---|---|---|---|
| 2025 | $4,517 | $305,000 | $245,520 | $59,480 |
| 2024 | $4,517 | $234,000 | $0 | $0 |
| 2023 | $3,723 | $195,000 | $105,820 | $89,180 |
| 2022 | $3,959 | $186,474 | $110,880 | $75,594 |
| 2021 | $4,034 | $181,459 | $110,880 | $70,579 |
| 2020 | $3,931 | $172,000 | $110,880 | $61,120 |
| 2019 | $4,056 | $170,000 | $110,880 | $59,120 |
| 2018 | $3,744 | $155,000 | $83,520 | $71,480 |
| 2017 | $3,831 | $155,000 | $83,520 | $71,480 |
| 2016 | $3,744 | $155,000 | $102,705 | $52,295 |
| 2015 | $1,302 | $105,617 | $61,500 | $44,117 |
| 2014 | $1,302 | $105,566 | $61,500 | $44,066 |
| 2013 | -- | $97,042 | $61,500 | $36,511 |
Source: Public Records
Map
Nearby Homes
- 1211 Lindsey St
- 1024 Greenlee St
- 1523 Oakwood Dr
- 1619 Mccormick St
- 631 Acme St
- 808 W Collins St
- 724 W Collins St
- 708 W Collins St
- 700 W Collins St
- 618 W Collins St
- 1308 Myrtle St
- 922 Fannin St Unit 102
- 1115 Mccormick St
- 104 Daugherty St
- 1301 Fannin St
- 2302 Mercedes Rd
- 2314 Leslie St
- 2305 Bernard St
- 110 E Daugherty St
- 1303 Fannin St
- 920 Lindsey St
- 1518 Bernard St
- 900 Lindsey St
- 903 Lindsey St
- 909 Lindsey St
- 901 Lindsey St
- 702 N Interstate 35 E
- 1608 Bernard St
- 1101 Lindsey St
- 1105 Lindsey St
- 1201 Lindsey St
- 1109 Lindsey St
- 1202 Lindsey St
- 1203 Lindsey St
- 1407 Bernard St
- 1100 Oakwood Dr
- 1205 Lindsey St
- 1206 Lindsey St
- 1304 Bernard St
- 1106 Oakwood Dr