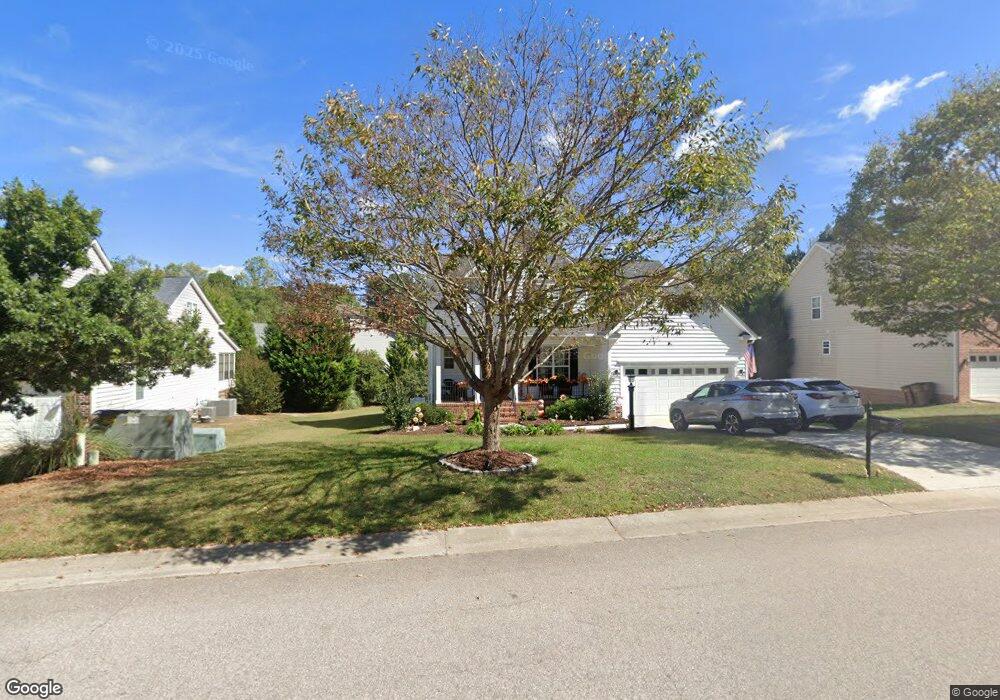
9144 Linslade Way Wake Forest, NC 27587
Estimated Value: $515,987 - $533,000
3
Beds
3
Baths
2,141
Sq Ft
$246/Sq Ft
Est. Value
About This Home
This home is located at 9144 Linslade Way, Wake Forest, NC 27587 and is currently estimated at $526,497, approximately $245 per square foot. 9144 Linslade Way is a home located in Wake County with nearby schools including Rolesville Elementary School, Wake Forest-Rolesville Middle School, and Heritage High School.
Ownership History
Date
Name
Owned For
Owner Type
Purchase Details
Closed on
Jun 17, 2021
Sold by
Hartig Donald D and Hartig Stephanie Stevens
Bought by
Peraza Donna M and Peraza Ruben
Current Estimated Value
Home Financials for this Owner
Home Financials are based on the most recent Mortgage that was taken out on this home.
Original Mortgage
$311,200
Outstanding Balance
$281,753
Interest Rate
2.9%
Mortgage Type
New Conventional
Estimated Equity
$244,744
Purchase Details
Closed on
May 24, 2006
Sold by
Centex Homes
Bought by
Stevens Stephanie Sue
Home Financials for this Owner
Home Financials are based on the most recent Mortgage that was taken out on this home.
Original Mortgage
$222,414
Interest Rate
6.41%
Mortgage Type
Purchase Money Mortgage
Purchase Details
Closed on
May 19, 2005
Sold by
Dansforth Development Llc
Bought by
Centex Homes
Create a Home Valuation Report for This Property
The Home Valuation Report is an in-depth analysis detailing your home's value as well as a comparison with similar homes in the area
Home Values in the Area
Average Home Value in this Area
Purchase History
| Date | Buyer | Sale Price | Title Company |
|---|---|---|---|
| Peraza Donna M | $389,000 | None Available | |
| Stevens Stephanie Sue | $278,500 | None Available | |
| Centex Homes | $1,129,500 | -- |
Source: Public Records
Mortgage History
| Date | Status | Borrower | Loan Amount |
|---|---|---|---|
| Open | Peraza Donna M | $311,200 | |
| Previous Owner | Stevens Stephanie Sue | $222,414 |
Source: Public Records
Tax History
| Year | Tax Paid | Tax Assessment Tax Assessment Total Assessment is a certain percentage of the fair market value that is determined by local assessors to be the total taxable value of land and additions on the property. | Land | Improvement |
|---|---|---|---|---|
| 2025 | $4,976 | $515,938 | $110,000 | $405,938 |
| 2024 | $4,957 | $515,938 | $110,000 | $405,938 |
Source: Public Records
Map
Nearby Homes
- 9117 Linslade Way
- 9108 Linslade Way
- 3705 Andoversford Ct
- 9100 Dansforeshire Way
- 3908 Robins Nest Ln
- 712 Marshall Farm St
- 749 Marshall Farm St
- 2925 Carriage Meadows Dr
- 6633 Penfield St
- 9637 Burge Ct
- 337 Simwood Ave
- 1321 Yardley Dr
- 9249 Kitchin Farms Way Unit 432
- 9237 Kitchin Farms Way Unit 429
- 3901 Sanford Creek Ave
- 9232 Kitchin Farms Way
- 2800 Carriage Meadows Dr
- 904 Prairie Smoke St
- 1000 Lightfoot Ct
- 3807 Crimson Clover Ave
- 9140 Linslade Way
- 9148 Linslade Way
- 3704 Tansley St
- 9136 Linslade Way
- 9145 Linslade Way
- 9141 Linslade Way
- 9149 Linslade Way
- 9137 Linslade Way
- 9200 Linslade Way
- 9132 Linslade Way
- 9133 Linslade Way
- 3620 Tansley St
- 9128 Linslade Way
- 3705 Tansley St
- 3625 Tansley St
- 3713 Tansley St
- 9204 Linslade Way
- 9129 Linslade Way
- 3709 Tansley St
- 3616 Tansley St
Your Personal Tour Guide
Ask me questions while you tour the home.