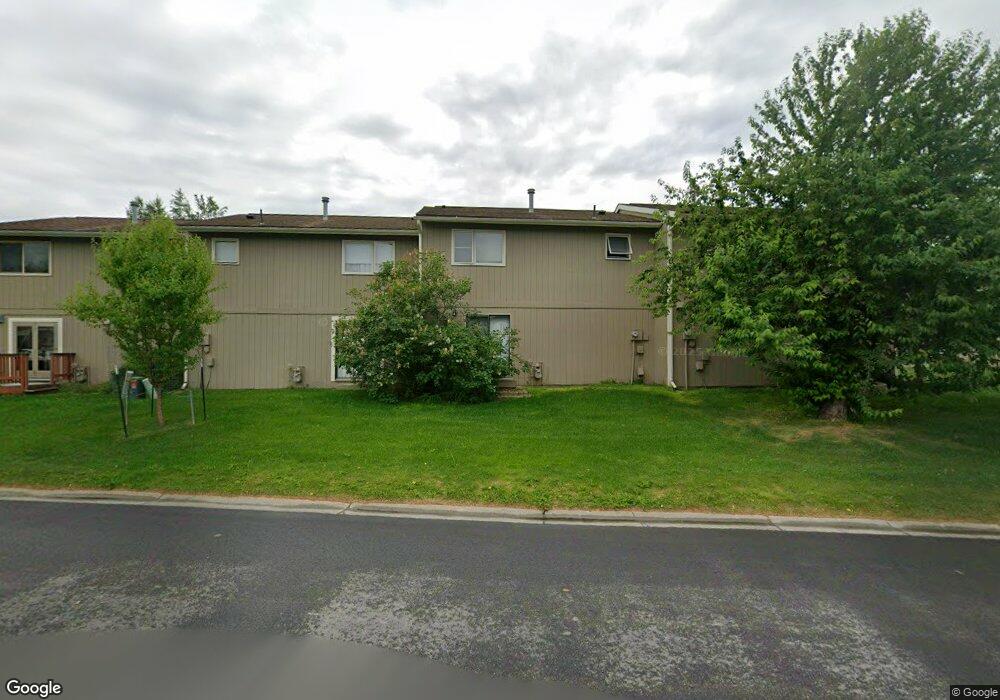
9145 Cranberry St Unit 21A Anchorage, AK 99502
Sand Lake NeighborhoodEstimated Value: $198,000 - $309,493
2
Beds
3
Baths
1,368
Sq Ft
$195/Sq Ft
Est. Value
About This Home
This home is located at 9145 Cranberry St Unit 21A, Anchorage, AK 99502 and is currently estimated at $266,164, approximately $194 per square foot. 9145 Cranberry St Unit 21A is a home located in Anchorage Municipality with nearby schools including Chinook Elementary School, Mears Middle School, and Dimond High School.
Ownership History
Date
Name
Owned For
Owner Type
Purchase Details
Closed on
Dec 3, 2020
Sold by
Deandrade Karen and Moore Karen
Bought by
Fernandez George
Current Estimated Value
Home Financials for this Owner
Home Financials are based on the most recent Mortgage that was taken out on this home.
Original Mortgage
$192,403
Outstanding Balance
$170,820
Interest Rate
2.8%
Mortgage Type
New Conventional
Estimated Equity
$95,344
Purchase Details
Closed on
Sep 13, 2013
Sold by
Moore Keith
Bought by
Moore Keith and Deandrade Karen
Purchase Details
Closed on
Feb 22, 2002
Sold by
Metzger Warren C and Metzger Kimberly S
Bought by
Moore Keith
Home Financials for this Owner
Home Financials are based on the most recent Mortgage that was taken out on this home.
Original Mortgage
$117,075
Interest Rate
7.04%
Mortgage Type
FHA
Purchase Details
Closed on
Dec 16, 1994
Sold by
Anderson Clara and Oldham Mary
Bought by
Metzger Warren G
Home Financials for this Owner
Home Financials are based on the most recent Mortgage that was taken out on this home.
Original Mortgage
$81,800
Interest Rate
9.1%
Mortgage Type
FHA
Create a Home Valuation Report for This Property
The Home Valuation Report is an in-depth analysis detailing your home's value as well as a comparison with similar homes in the area
Home Values in the Area
Average Home Value in this Area
Purchase History
| Date | Buyer | Sale Price | Title Company |
|---|---|---|---|
| Fernandez George | -- | None Listed On Document | |
| Moore Keith | -- | None Available | |
| Moore Keith | -- | First American Title | |
| Metzger Warren G | -- | -- |
Source: Public Records
Mortgage History
| Date | Status | Borrower | Loan Amount |
|---|---|---|---|
| Open | Fernandez George | $192,403 | |
| Previous Owner | Moore Keith | $117,075 | |
| Previous Owner | Metzger Warren G | $81,800 |
Source: Public Records
Tax History Compared to Growth
Tax History
| Year | Tax Paid | Tax Assessment Tax Assessment Total Assessment is a certain percentage of the fair market value that is determined by local assessors to be the total taxable value of land and additions on the property. | Land | Improvement |
|---|---|---|---|---|
| 2025 | $4,041 | $263,900 | $48,000 | $215,900 |
| 2024 | $4,041 | $250,300 | $48,000 | $202,300 |
| 2023 | $4,120 | $241,900 | $48,000 | $193,900 |
| 2022 | $3,855 | $228,900 | $48,100 | $180,800 |
| 2021 | $3,689 | $204,700 | $48,100 | $156,600 |
| 2020 | $3,482 | $204,800 | $48,100 | $156,700 |
| 2019 | $3,457 | $211,300 | $48,100 | $163,200 |
| 2018 | $3,303 | $201,400 | $37,900 | $163,500 |
| 2017 | $2,936 | $187,500 | $37,900 | $149,600 |
| 2016 | $2,672 | $188,300 | $37,900 | $150,400 |
| 2015 | $2,672 | $187,200 | $37,900 | $149,300 |
| 2014 | $2,672 | $177,400 | $37,900 | $139,500 |
Source: Public Records
Map
Nearby Homes
- 2923 Kingfisher Dr
- 8930 Arlene St
- 8920 Arlene St
- 3461 Red Rock Ct
- L09 B2 Dewberry St
- L10 B2 Dewberry St
- L9-10 B2 Dewberry St
- 9630 Arlene Dr
- 000 Emerald Hills
- 9336 Blackberry St Unit 5
- 9520 Albatross Dr
- 2542 Curlew Cir Unit 5
- 8641 Blackberry St Unit 19B
- 8611 Flamingo Dr
- 2541 Lyvona Ln
- 2320 Tasha Dr
- Lot 8 Quartz Cir
- 3769 Quartz Cir
- 2105 Minerva Way Unit 2105
- L7 Molanary Dr
- 9145 Cranberry St
- 9147 Cranberry St
- 9149 Cranberry St
- 9149 Cranberry St
- 9151 Cranberry St
- 9143 Cranberry St
- 9141 Cranberry St
- 9153 Cranberry St
- 9139 Cranberry St
- 9113 Cranberry St
- 9111 Cranberry St
- 9139 Cranberry Way
- 9111 Cranberry St
- 9115 Cranberry St
- 9137 Cranberry St
- 9155 Cranberry St
- 9109 Cranberry St
- 9135 Cranberry St
- 9135 Cranberry St
- 9157 Cranberry St