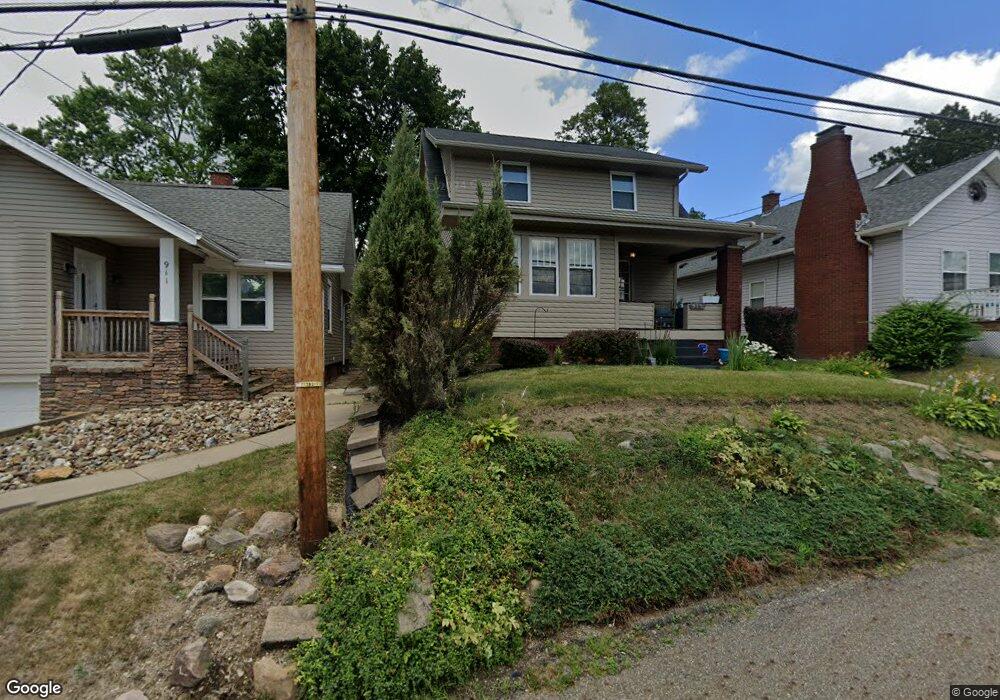
915 20th St NE Canton, OH 44714
Colonial Heights NeighborhoodEstimated Value: $151,000 - $166,545
2
Beds
2
Baths
1,700
Sq Ft
$93/Sq Ft
Est. Value
About This Home
This home is located at 915 20th St NE, Canton, OH 44714 and is currently estimated at $157,886, approximately $92 per square foot. 915 20th St NE is a home located in Stark County with nearby schools including Belle Stone Elementary School, Early Learning Center @ Schreiber, and Youtz Intermediate School.
Ownership History
Date
Name
Owned For
Owner Type
Purchase Details
Closed on
Jun 25, 2004
Sold by
Owens Lucinda A
Bought by
Owens Willie and Owens Lucinda A
Current Estimated Value
Home Financials for this Owner
Home Financials are based on the most recent Mortgage that was taken out on this home.
Original Mortgage
$110,000
Outstanding Balance
$58,613
Interest Rate
7.25%
Mortgage Type
Stand Alone Refi Refinance Of Original Loan
Estimated Equity
$99,273
Purchase Details
Closed on
Jun 27, 2002
Sold by
Prince Sr Gary L and Prince Anna P
Bought by
Owens Lucinda A
Home Financials for this Owner
Home Financials are based on the most recent Mortgage that was taken out on this home.
Original Mortgage
$93,758
Interest Rate
6.93%
Mortgage Type
FHA
Purchase Details
Closed on
Jun 25, 2001
Sold by
Hoover Ann P and Hoover Anna P
Bought by
Prince Sr Gary L and Prince Anna P
Home Financials for this Owner
Home Financials are based on the most recent Mortgage that was taken out on this home.
Original Mortgage
$71,400
Interest Rate
7.2%
Mortgage Type
Purchase Money Mortgage
Create a Home Valuation Report for This Property
The Home Valuation Report is an in-depth analysis detailing your home's value as well as a comparison with similar homes in the area
Home Values in the Area
Average Home Value in this Area
Purchase History
| Date | Buyer | Sale Price | Title Company |
|---|---|---|---|
| Owens Willie | -- | Multiple | |
| Owens Lucinda A | $94,500 | -- | |
| Prince Sr Gary L | -- | Lawyers Title Ins Corp |
Source: Public Records
Mortgage History
| Date | Status | Borrower | Loan Amount |
|---|---|---|---|
| Open | Owens Willie | $110,000 | |
| Closed | Owens Lucinda A | $93,758 | |
| Previous Owner | Prince Sr Gary L | $71,400 |
Source: Public Records
Tax History Compared to Growth
Tax History
| Year | Tax Paid | Tax Assessment Tax Assessment Total Assessment is a certain percentage of the fair market value that is determined by local assessors to be the total taxable value of land and additions on the property. | Land | Improvement |
|---|---|---|---|---|
| 2025 | -- | $55,620 | $8,890 | $46,730 |
| 2024 | -- | $55,620 | $8,890 | $46,730 |
| 2023 | $1,856 | $31,050 | $5,740 | $25,310 |
| 2022 | $1,803 | $31,050 | $5,740 | $25,310 |
| 2021 | $1,821 | $31,050 | $5,740 | $25,310 |
| 2020 | $1,627 | $24,820 | $4,620 | $20,200 |
| 2019 | $1,420 | $24,820 | $4,620 | $20,200 |
| 2018 | $1,428 | $24,820 | $4,620 | $20,200 |
| 2017 | $1,478 | $23,390 | $4,380 | $19,010 |
| 2016 | $1,483 | $23,390 | $4,380 | $19,010 |
| 2015 | $1,492 | $23,390 | $4,380 | $19,010 |
| 2014 | $1,693 | $24,960 | $4,660 | $20,300 |
| 2013 | $814 | $24,960 | $4,660 | $20,300 |
Source: Public Records
Map
Nearby Homes
- 918 19th St NE
- 908 22nd St NE
- 0 Rowland Ave NE Unit 5089960
- 1126 18th St NE
- 2219 Rowland Ave NE
- 1734 Rowland Ave NE
- 1219 17th St NE
- 1210 17th St NE
- 802 17th St NE
- 1220 25th St NE
- 1513 22nd St NE
- 1631 Shriver Ave NE
- 1540 Miami Ct NE
- 2216 University Ave NW
- 1611 Rowland Ave NE
- 1521 Gibbs Ave NE
- 1607 18th St NE
- 1602 18th St NE
- 206 21st St NW
- 1517 16th St NE
- 919 20th St NE
- 911 20th St NE
- 1001 20th St NE
- 903 20th St NE
- 1005 20th St NE
- 1937 Miami Ct NE
- 1000 21st St NE
- 908 21st St NE
- 821 20th St NE
- 1009 20th St NE
- 1933 Miami Ct NE
- 1936 Miami Ct NE
- 902 20th St NE
- 900 21st St NE
- 817 20th St NE
- 1006 21st St NE
- 1925 Miami Ct NE
- 1932 Miami Ct NE
- 820 20th St NE
- 813 20th St NE