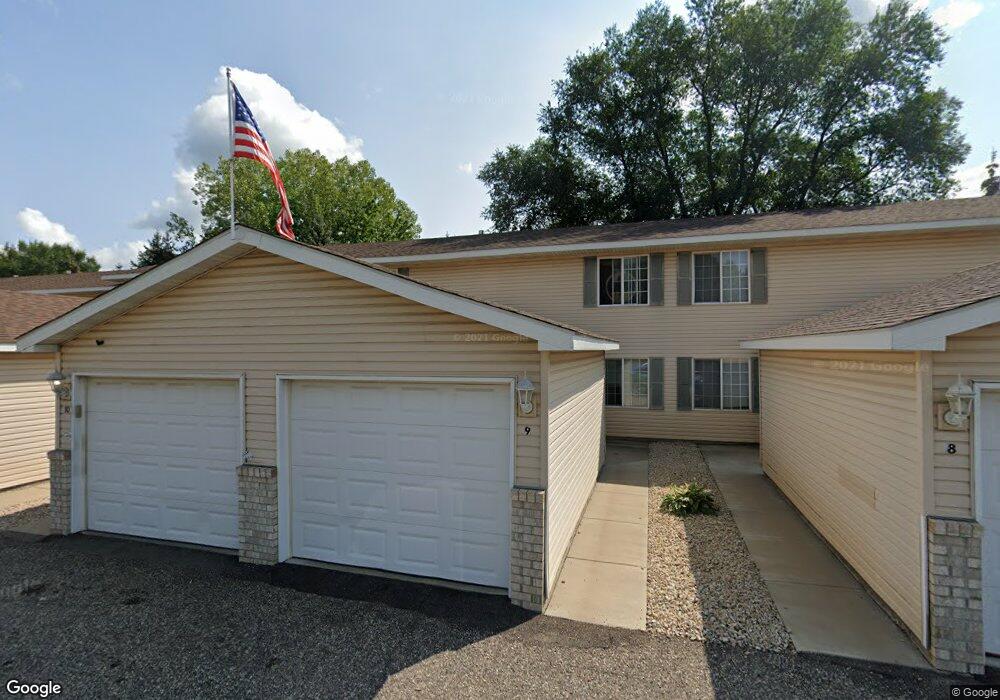
915 7th St Unit 13 Jordan, MN 55352
Estimated Value: $146,000 - $173,000
2
Beds
1
Bath
886
Sq Ft
$179/Sq Ft
Est. Value
About This Home
This home is located at 915 7th St Unit 13, Jordan, MN 55352 and is currently estimated at $159,000, approximately $179 per square foot. 915 7th St Unit 13 is a home located in Scott County with nearby schools including Jordan Elementary School, Jordan Middle School, and Jordan High School.
Ownership History
Date
Name
Owned For
Owner Type
Purchase Details
Closed on
Oct 12, 2022
Sold by
Smith Timothy J and Smith Heidi S
Bought by
Greenleaf Townhomes Llc
Current Estimated Value
Home Financials for this Owner
Home Financials are based on the most recent Mortgage that was taken out on this home.
Original Mortgage
$937,500
Outstanding Balance
$422,992
Interest Rate
5.66%
Mortgage Type
New Conventional
Estimated Equity
-$263,992
Purchase Details
Closed on
Sep 2, 2008
Sold by
Deutsche Bank Na
Bought by
Leal Joshua
Purchase Details
Closed on
May 6, 2005
Sold by
Jordan Greenleaf Properties Llp
Bought by
Angulo Joel A and Angulo Maria
Create a Home Valuation Report for This Property
The Home Valuation Report is an in-depth analysis detailing your home's value as well as a comparison with similar homes in the area
Home Values in the Area
Average Home Value in this Area
Purchase History
| Date | Buyer | Sale Price | Title Company |
|---|---|---|---|
| Greenleaf Townhomes Llc | $1,250,000 | -- | |
| Leal Joshua | $50,000 | -- | |
| Angulo Joel A | $138,600 | -- |
Source: Public Records
Mortgage History
| Date | Status | Borrower | Loan Amount |
|---|---|---|---|
| Open | Greenleaf Townhomes Llc | $937,500 |
Source: Public Records
Tax History
| Year | Tax Paid | Tax Assessment Tax Assessment Total Assessment is a certain percentage of the fair market value that is determined by local assessors to be the total taxable value of land and additions on the property. | Land | Improvement |
|---|---|---|---|---|
| 2025 | $1,528 | $131,900 | $34,600 | $97,300 |
| 2024 | $1,308 | $118,100 | $32,300 | $85,800 |
| 2023 | $1,208 | $98,700 | $13,200 | $85,500 |
| 2022 | $1,178 | $98,800 | $13,200 | $85,600 |
| 2021 | $1,144 | $78,500 | $11,000 | $67,500 |
| 2020 | $1,120 | $76,200 | $9,500 | $66,700 |
| 2019 | $994 | $72,500 | $6,300 | $66,200 |
| 2018 | $1,042 | $0 | $0 | $0 |
| 2016 | $782 | $0 | $0 | $0 |
| 2014 | -- | $0 | $0 | $0 |
Source: Public Records
Map
Nearby Homes
- 4X Valley View Dr
- 6X Valley View Dr
- 2X Valley View Dr
- 1X Valley View Dr
- 5X Valley View Dr
- 1X Ervin Industrial Dr
- 6305 W 190th Street (7acres)
- 213 Jennifer Ln
- 712 Syndicate St
- 1X Highway 169
- 817 Bradbury Cir
- 408 Bentley Ct
- 1XX Highway 169
- 6305 W 190th Street (22 Acres)
- 6305 X 15A W 190th St
- 309 2nd St W
- 112 Rustle Rd
- 309 Arabian Dr
- 6851 W 195th St
- 1258 Beaumont Blvd
Your Personal Tour Guide
Ask me questions while you tour the home.