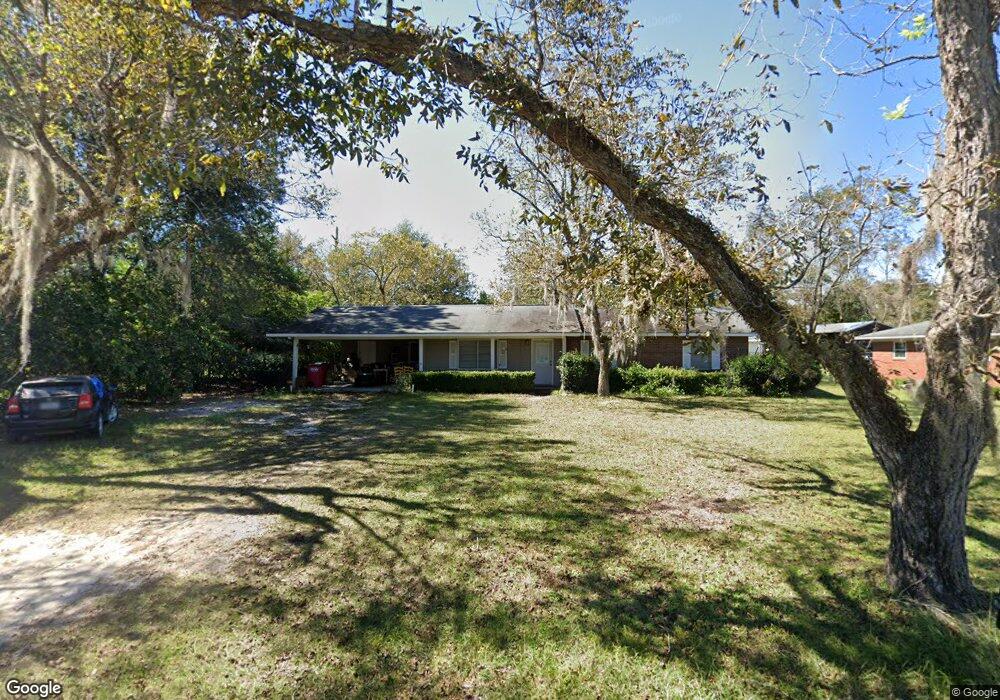
915 Bud St Blackshear, GA 31516
Estimated Value: $153,601 - $205,000
3
Beds
1
Bath
1,232
Sq Ft
$144/Sq Ft
Est. Value
About This Home
This home is located at 915 Bud St, Blackshear, GA 31516 and is currently estimated at $177,900, approximately $144 per square foot. 915 Bud St is a home located in Pierce County with nearby schools including Pierce County High School, Southeast Christian Academy, and Truth Christian Academy.
Ownership History
Date
Name
Owned For
Owner Type
Purchase Details
Closed on
Jun 16, 2021
Sold by
Jacobs Jonathan Shawn
Bought by
Crews Amanda Gale
Current Estimated Value
Home Financials for this Owner
Home Financials are based on the most recent Mortgage that was taken out on this home.
Original Mortgage
$115,000
Outstanding Balance
$104,962
Interest Rate
2.9%
Mortgage Type
New Conventional
Estimated Equity
$72,938
Purchase Details
Closed on
Mar 1, 2014
Sold by
Jacobs Johnny Owen
Bought by
Jacobs Jonathan Shawn and Jacobs Joshua Robert
Purchase Details
Closed on
Dec 12, 2006
Sold by
Colson Patricia Mckee
Bought by
Jacobs Johnny O and Jacobs Jami
Purchase Details
Closed on
Jul 20, 1989
Sold by
Mckee Lester W
Bought by
Mckee Juanita D
Purchase Details
Closed on
Jan 1, 1968
Sold by
Groover James M and Groover Strickland W
Bought by
Mckee Lester W
Create a Home Valuation Report for This Property
The Home Valuation Report is an in-depth analysis detailing your home's value as well as a comparison with similar homes in the area
Home Values in the Area
Average Home Value in this Area
Purchase History
| Date | Buyer | Sale Price | Title Company |
|---|---|---|---|
| Crews Amanda Gale | $115,000 | -- | |
| Jacobs Jonathan Shawn | -- | -- | |
| Jacobs Johnny O | $61,000 | -- | |
| Mckee Juanita D | -- | -- | |
| Mckee Lester W | -- | -- |
Source: Public Records
Mortgage History
| Date | Status | Borrower | Loan Amount |
|---|---|---|---|
| Open | Crews Amanda Gale | $115,000 |
Source: Public Records
Tax History Compared to Growth
Tax History
| Year | Tax Paid | Tax Assessment Tax Assessment Total Assessment is a certain percentage of the fair market value that is determined by local assessors to be the total taxable value of land and additions on the property. | Land | Improvement |
|---|---|---|---|---|
| 2025 | $1,537 | $49,284 | $10,200 | $39,084 |
| 2024 | $1,537 | $47,930 | $10,200 | $37,730 |
| 2023 | $1,493 | $46,546 | $10,200 | $36,346 |
| 2022 | $1,090 | $28,703 | $2,886 | $25,817 |
| 2021 | $1,129 | $27,609 | $2,886 | $24,723 |
| 2020 | $1,098 | $26,515 | $2,886 | $23,629 |
| 2019 | $1,098 | $26,515 | $2,886 | $23,629 |
| 2018 | $1,056 | $25,421 | $2,886 | $22,535 |
| 2017 | $1,031 | $24,765 | $2,886 | $21,879 |
| 2016 | $1,029 | $24,765 | $2,886 | $21,879 |
| 2015 | $838 | $24,765 | $2,886 | $21,879 |
| 2014 | $838 | $24,765 | $2,886 | $21,879 |
| 2013 | $838 | $24,765 | $2,886 | $21,879 |
Source: Public Records
Map
Nearby Homes
- 810 Jackson St
- 420 Jackson St
- 331 Central Ave W
- 515 Grady St
- 322 Mcgregor St
- 0001 Georgia 121
- ST. ROUTE 121 Georgia 121
- TRACT 1 Trudie Rd
- 1157 Tanner Cir
- 622 E Main St
- 3551 Cason Rd
- 706 Jenkins St
- 121 Beaver Dr
- 830 Jane St
- 3360 Strickland Avenue Extension
- 0 Trudie Rd
- 3344 Strickland Ave
- 936 Azalea St
- 933 Azalea St
- 915 Jane St