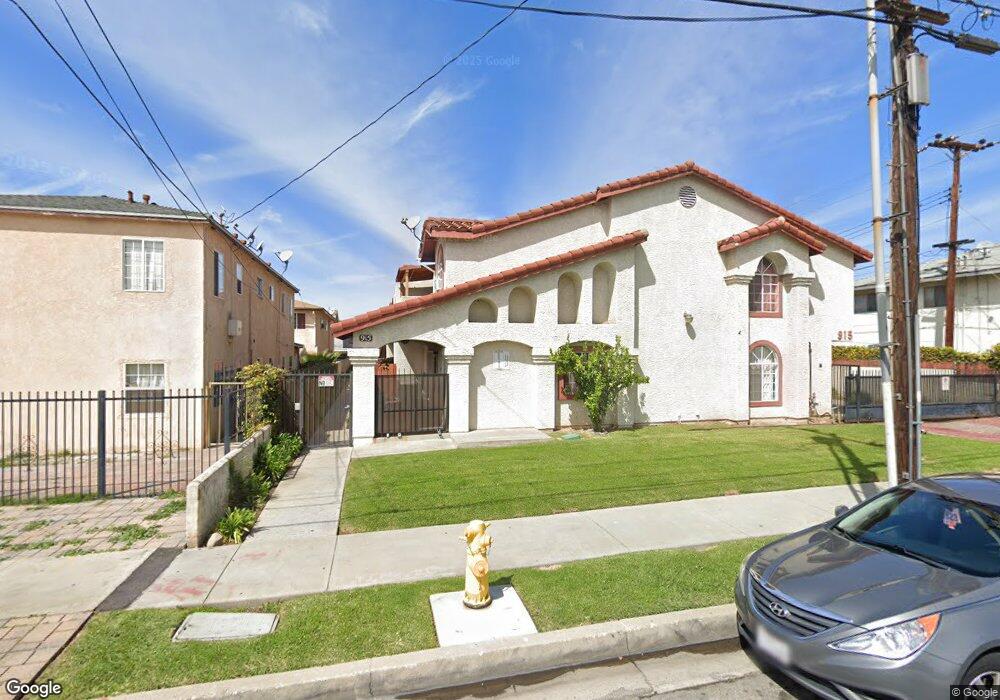
915 Carob Way Unit 4 Montebello, CA 90640
Estimated Value: $524,000 - $680,000
3
Beds
2
Baths
1,262
Sq Ft
$465/Sq Ft
Est. Value
About This Home
This home is located at 915 Carob Way Unit 4, Montebello, CA 90640 and is currently estimated at $586,986, approximately $465 per square foot. 915 Carob Way Unit 4 is a home located in Los Angeles County with nearby schools including Greenwood Elementary School, Montebello Intermediate School, and Montebello High School.
Ownership History
Date
Name
Owned For
Owner Type
Purchase Details
Closed on
Apr 25, 2003
Sold by
Barela Gilbert
Bought by
Iloff Jeanne
Current Estimated Value
Purchase Details
Closed on
Apr 17, 2000
Sold by
Dela Paz Frances A
Bought by
Iloff Jeanne and Barela Gilbert
Home Financials for this Owner
Home Financials are based on the most recent Mortgage that was taken out on this home.
Original Mortgage
$126,000
Interest Rate
8.22%
Mortgage Type
FHA
Purchase Details
Closed on
Apr 16, 1996
Sold by
916 Montebello Blvd Lp
Bought by
Delapaz Frances Arleen
Home Financials for this Owner
Home Financials are based on the most recent Mortgage that was taken out on this home.
Original Mortgage
$121,600
Interest Rate
7.68%
Create a Home Valuation Report for This Property
The Home Valuation Report is an in-depth analysis detailing your home's value as well as a comparison with similar homes in the area
Home Values in the Area
Average Home Value in this Area
Purchase History
| Date | Buyer | Sale Price | Title Company |
|---|---|---|---|
| Iloff Jeanne | -- | Security Union Title | |
| Iloff Jeanne | $130,000 | Fidelity Title | |
| Delapaz Frances Arleen | $127,272 | Old Republic Title Company |
Source: Public Records
Mortgage History
| Date | Status | Borrower | Loan Amount |
|---|---|---|---|
| Previous Owner | Iloff Jeanne | $126,000 | |
| Previous Owner | Delapaz Frances Arleen | $121,600 |
Source: Public Records
Tax History Compared to Growth
Tax History
| Year | Tax Paid | Tax Assessment Tax Assessment Total Assessment is a certain percentage of the fair market value that is determined by local assessors to be the total taxable value of land and additions on the property. | Land | Improvement |
|---|---|---|---|---|
| 2025 | $3,262 | $227,979 | $70,660 | $157,319 |
| 2024 | $3,262 | $223,510 | $69,275 | $154,235 |
| 2023 | $3,256 | $219,128 | $67,917 | $151,211 |
| 2022 | $3,146 | $214,833 | $66,586 | $148,247 |
| 2021 | $3,032 | $210,622 | $65,281 | $145,341 |
| 2019 | $2,915 | $204,377 | $63,346 | $141,031 |
| 2018 | $2,940 | $200,370 | $62,104 | $138,266 |
| 2017 | $2,871 | $196,442 | $60,887 | $135,555 |
| 2016 | $2,799 | $192,592 | $59,694 | $132,898 |
| 2015 | $2,645 | $189,700 | $58,798 | $130,902 |
| 2014 | $2,610 | $185,985 | $57,647 | $128,338 |
Source: Public Records
Map
Nearby Homes
- 919 Carob Way
- 932 S Montebello Blvd
- 524 Washington Blvd
- 908 S 4th St
- 912 Jacmar Dr
- 965 Acacia Ln
- 730 Frankel Ave Unit B9
- 740 Albee St
- 1032 S Greenwood Ave
- 1109 S Spruce St
- 859 W Carmelita Ave
- 704 S Taylor Ave
- 637 Carmelita Place
- 552 S 6th St
- 816 W Mines Ave
- 522 S 5th St
- 862 W Mines Ave
- 439 S Montebello Blvd
- 630 S Maple Ave Unit 44
- 630 S Maple Ave Unit 7
- 915 Carob Way
- 915 Carob Way
- 915 Carob Way Unit 1
- 915 Carob Way Unit 3
- 915 Carob Way Unit 6
- 915 Carob Way Unit 7
- 915 Carob Way Unit 8
- 915 Carob Way Unit 9
- 916 S Montebello Blvd
- 916 S Montebello Blvd Unit 4
- 916 S Montebello Blvd Unit 9
- 916 S Montebello Blvd Unit 8
- 916 S Montebello Blvd Unit 7
- 916 S Montebello Blvd Unit 6
- 916 S Montebello Blvd Unit 5
- 916 S Montebello Blvd Unit 3
- 916 S Montebello Blvd Unit 2
- 916 S Montebello Blvd Unit 1
- 916 S 4th St
- 916 S 5th St