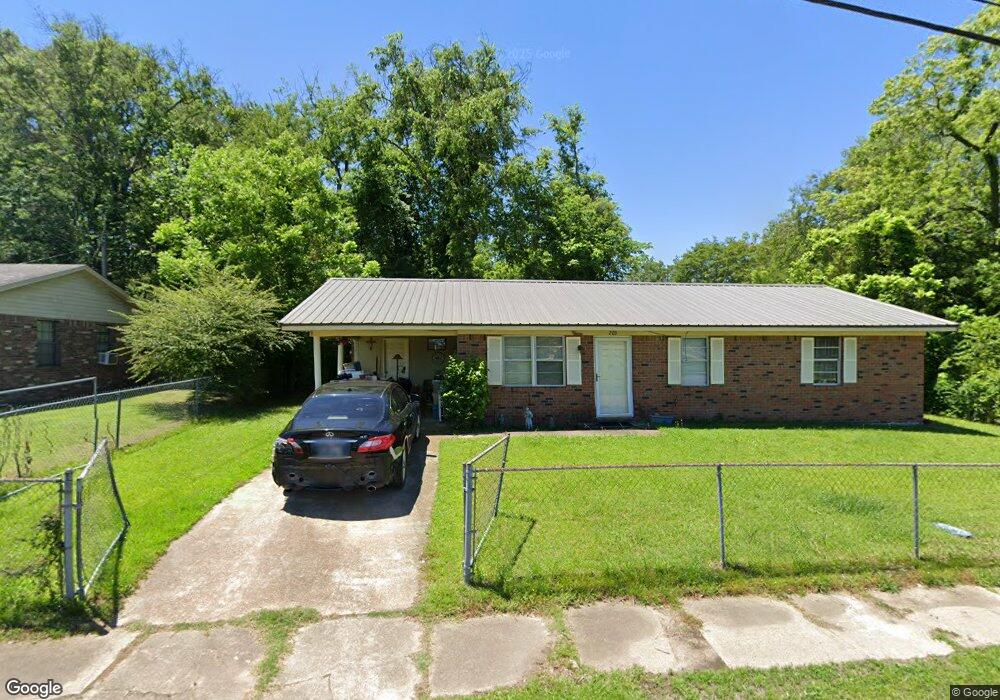
915 Cromwell St West Point, MS 39773
Estimated Value: $70,000 - $106,000
3
Beds
--
Bath
1,238
Sq Ft
$75/Sq Ft
Est. Value
About This Home
This home is located at 915 Cromwell St, West Point, MS 39773 and is currently estimated at $92,929, approximately $75 per square foot. 915 Cromwell St is a home located in Clay County with nearby schools including East Side Elementary School, West Clay Elementary School, and Church Hill Elementary School.
Ownership History
Date
Name
Owned For
Owner Type
Purchase Details
Closed on
Oct 1, 2012
Sold by
Jpmorgan Chase Bank Na
Bought by
Duke Residental Properties Llc
Current Estimated Value
Purchase Details
Closed on
Apr 24, 2007
Sold by
Irions Daniel L
Bought by
Booker Onie L
Home Financials for this Owner
Home Financials are based on the most recent Mortgage that was taken out on this home.
Original Mortgage
$68,200
Interest Rate
6.1%
Create a Home Valuation Report for This Property
The Home Valuation Report is an in-depth analysis detailing your home's value as well as a comparison with similar homes in the area
Home Values in the Area
Average Home Value in this Area
Purchase History
| Date | Buyer | Sale Price | Title Company |
|---|---|---|---|
| Duke Residental Properties Llc | $32,500 | -- | |
| Booker Onie L | -- | -- |
Source: Public Records
Mortgage History
| Date | Status | Borrower | Loan Amount |
|---|---|---|---|
| Previous Owner | Booker Onie L | $68,200 |
Source: Public Records
Tax History Compared to Growth
Tax History
| Year | Tax Paid | Tax Assessment Tax Assessment Total Assessment is a certain percentage of the fair market value that is determined by local assessors to be the total taxable value of land and additions on the property. | Land | Improvement |
|---|---|---|---|---|
| 2024 | $464 | $8,548 | $1,084 | $7,464 |
| 2023 | $1,106 | $7,392 | $1,084 | $6,308 |
| 2022 | $406 | $7,392 | $1,084 | $6,308 |
| 2021 | $404 | $7,392 | $1,084 | $6,308 |
| 2020 | $406 | $7,392 | $1,084 | $6,308 |
| 2019 | $377 | $7,335 | $1,084 | $6,251 |
| 2018 | $362 | $7,335 | $1,084 | $6,251 |
| 2017 | $362 | $7,335 | $1,084 | $6,251 |
| 2016 | $354 | $7,335 | $1,084 | $6,251 |
| 2015 | $347 | $6,962 | $1,084 | $5,878 |
| 2014 | $211 | $6,962 | $1,084 | $5,878 |
| 2013 | $211 | $6,962 | $1,084 | $5,878 |
Source: Public Records
Map
Nearby Homes
- 346 E Brame Ave
- 402 Cromwell St
- 238 Calhoun St
- 206 S Division St
- 228 S Division St
- 98 Court St
- 184 Tournament St
- 229 S Division St
- 1046 E Brame Ave
- 480 E Westbrook St
- 479 E Westbrook St
- 15 David St
- 159 Washington St
- 485 E Westbrook St
- 551 E Westbrook St
- 1104 E Broad St
- 1180 E Broad St
- 1153 E Broad St
- 26788 E Main St
- 472 S Eshman Ave
- 917 Cromwell St
- 905 Cromwell St
- 923 Cromwell St
- 349 Tom Bayne St
- 927 Cromwell St
- 328 Tom Bayne St
- 343 Tom Bayne St
- 331 Tom Bayne St
- 337 Tom Bayne St
- 327 Tom Bayne St
- 324 Tom Bayne St
- 92 Tom Bayne St
- 320 Tom Bayne St
- 855 Cromwell St
- 849 Cromwell St
- 906 Grove St
- 902 Grove St
- 910 Grove St
- 856 Grove St
- 914 Grove St