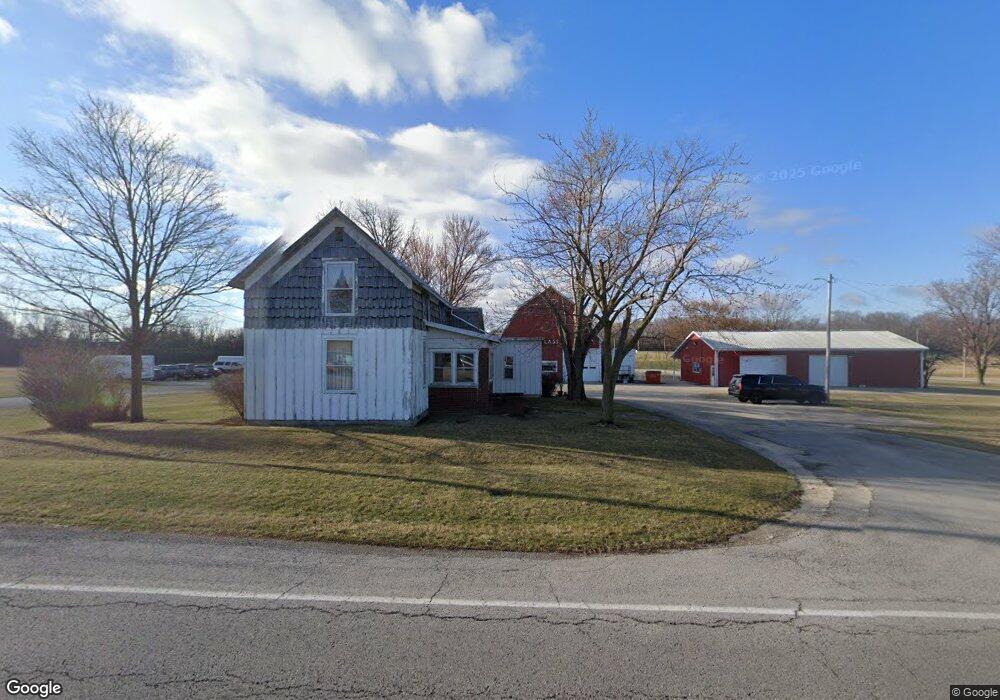
915 E Bigelow Ave Findlay, OH 45840
Estimated Value: $194,000 - $274,832
3
Beds
1
Bath
1,564
Sq Ft
$146/Sq Ft
Est. Value
About This Home
This home is located at 915 E Bigelow Ave, Findlay, OH 45840 and is currently estimated at $228,708, approximately $146 per square foot. 915 E Bigelow Ave is a home located in Hancock County with nearby schools including Bigelow Hill Elementary School, Northview Elementary School, and Glenwood Middle School.
Ownership History
Date
Name
Owned For
Owner Type
Purchase Details
Closed on
Dec 11, 2020
Sold by
Fish M Martha M and Fish Mary Martha
Bought by
Fish Jay B and Fish Jeffrey A
Current Estimated Value
Purchase Details
Closed on
Jan 28, 1994
Bought by
Fish Joe B and Fish Martha M
Create a Home Valuation Report for This Property
The Home Valuation Report is an in-depth analysis detailing your home's value as well as a comparison with similar homes in the area
Home Values in the Area
Average Home Value in this Area
Purchase History
| Date | Buyer | Sale Price | Title Company |
|---|---|---|---|
| Fish Jay B | -- | None Available | |
| Fish Joe B | -- | -- |
Source: Public Records
Tax History Compared to Growth
Tax History
| Year | Tax Paid | Tax Assessment Tax Assessment Total Assessment is a certain percentage of the fair market value that is determined by local assessors to be the total taxable value of land and additions on the property. | Land | Improvement |
|---|---|---|---|---|
| 2024 | $3,028 | $82,840 | $17,650 | $65,190 |
| 2023 | $3,034 | $82,840 | $17,650 | $65,190 |
| 2022 | $3,023 | $82,840 | $17,650 | $65,190 |
| 2021 | $3,265 | $77,740 | $20,650 | $57,090 |
| 2020 | $3,265 | $77,740 | $20,650 | $57,090 |
| 2019 | $3,665 | $77,740 | $20,650 | $57,090 |
| 2018 | $3,459 | $66,510 | $15,890 | $50,620 |
| 2017 | $1,770 | $66,510 | $15,890 | $50,620 |
| 2016 | $3,502 | $66,510 | $15,890 | $50,620 |
| 2015 | $2,917 | $51,810 | $8,890 | $42,920 |
| 2014 | $2,865 | $51,810 | $8,890 | $42,920 |
| 2012 | $2,953 | $53,560 | $10,610 | $42,950 |
Source: Public Records
Map
Nearby Homes
- 0 E Melrose Ave
- 6434 County Road 18
- 231 Tioga Ave
- 600 Charles Ave
- 1908 Gayle Ln
- 1928 Deer Ridge Dr
- 1928 Deer Ridge Dr Unit L-133
- 1865 Breckenridge Rd
- 128 Harrington Ave
- 0 Sheridan Ave
- 3315 Terrace Ln
- 2100 Candlewick Dr
- 1736 Woodridge Crescent
- 1474 Southwood Ave
- 0 Keith Pkwy Unit 6123798
- 0 Keith Pkwy Unit 20244552
- 3239 N Main St
- 126 Hillcrest Ave
- 715 Christina Ct
- 1825 Pershing St
- 1103 E Bigelow Ave
- 1111 E Bigelow Ave
- 1201 E Bigelow Ave
- 811 E Bigelow Ave
- 2617 Aberdeen Dr
- 1020 Doune Dr
- 1215 E Bigelow Ave
- 1040 Doune Dr
- 1003 Doune Dr
- 1003 Doune Dr Unit LOT 182
- 2529 Aberdeen Dr
- 1225 E Bigelow Ave
- 2508 E Skye View Dr
- 2509 Aberdeen Dr
- 1231 E Bigelow Ave
- 523 E Bigelow Ave
- 2408 E Dundee Dr Unit L-145
- 520 E Bigelow Ave
- 2340 Braemar Dr
- 1311 E Bigelow Ave