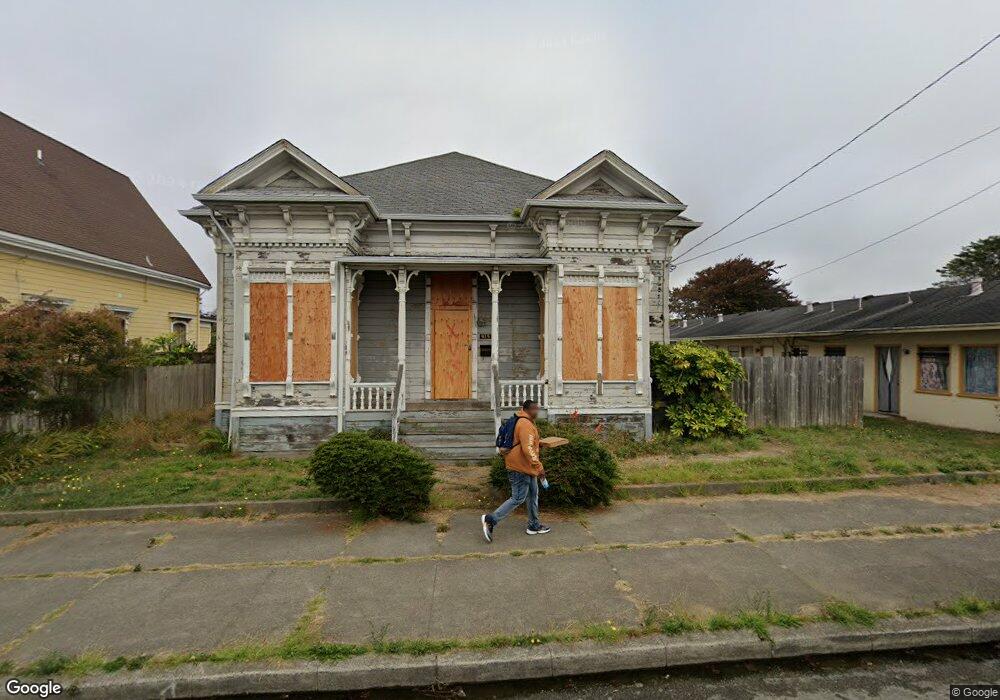
915 G St Eureka, CA 95501
Broadway Street NeighborhoodEstimated Value: $249,000 - $770,000
Studio
--
Bath
--
Sq Ft
6,534
Sq Ft Lot
About This Home
This home is located at 915 G St, Eureka, CA 95501 and is currently estimated at $453,612. 915 G St is a home located in Humboldt County with nearby schools including Lafayette Elementary School, Catherine L. Zane Middle School, and Eureka Senior High School.
Ownership History
Date
Name
Owned For
Owner Type
Purchase Details
Closed on
Oct 30, 2024
Sold by
Robison Jay S
Bought by
S & S Phelps Inc
Current Estimated Value
Home Financials for this Owner
Home Financials are based on the most recent Mortgage that was taken out on this home.
Original Mortgage
$371,000
Outstanding Balance
$367,307
Interest Rate
6.12%
Mortgage Type
New Conventional
Estimated Equity
$86,305
Purchase Details
Closed on
Apr 10, 2003
Sold by
Robison David P
Bought by
Robison Jay S and Miller Jan E
Home Financials for this Owner
Home Financials are based on the most recent Mortgage that was taken out on this home.
Original Mortgage
$100,000
Interest Rate
5.54%
Mortgage Type
Purchase Money Mortgage
Create a Home Valuation Report for This Property
The Home Valuation Report is an in-depth analysis detailing your home's value as well as a comparison with similar homes in the area
Home Values in the Area
Average Home Value in this Area
Purchase History
| Date | Buyer | Sale Price | Title Company |
|---|---|---|---|
| S & S Phelps Inc | $530,000 | Fidelity National Title Compan | |
| S & S Phelps Inc | $530,000 | Fidelity National Title Compan | |
| Robison Jay S | $35,000 | Fidelity National |
Source: Public Records
Mortgage History
| Date | Status | Borrower | Loan Amount |
|---|---|---|---|
| Open | S & S Phelps Inc | $371,000 | |
| Closed | S & S Phelps Inc | $371,000 | |
| Previous Owner | Robison Jay S | $100,000 |
Source: Public Records
Tax History
| Year | Tax Paid | Tax Assessment Tax Assessment Total Assessment is a certain percentage of the fair market value that is determined by local assessors to be the total taxable value of land and additions on the property. | Land | Improvement |
|---|---|---|---|---|
| 2025 | $1,474 | $240,000 | $165,000 | $75,000 |
| 2024 | $1,474 | $140,491 | $57,470 | $83,021 |
| 2023 | $1,453 | $137,738 | $56,344 | $81,394 |
| 2022 | $1,508 | $135,039 | $55,240 | $79,799 |
| 2021 | $1,413 | $132,392 | $54,157 | $78,235 |
| 2020 | $1,402 | $131,035 | $53,602 | $77,433 |
| 2019 | $1,373 | $128,466 | $52,551 | $75,915 |
| 2018 | $1,353 | $125,948 | $51,521 | $74,427 |
| 2017 | $1,346 | $123,479 | $50,511 | $72,968 |
| 2016 | $1,346 | $121,059 | $49,521 | $71,538 |
| 2015 | $1,334 | $119,242 | $48,778 | $70,464 |
| 2014 | $1,247 | $116,907 | $47,823 | $69,084 |
Source: Public Records
Map
Nearby Homes
Your Personal Tour Guide
Ask me questions while you tour the home.