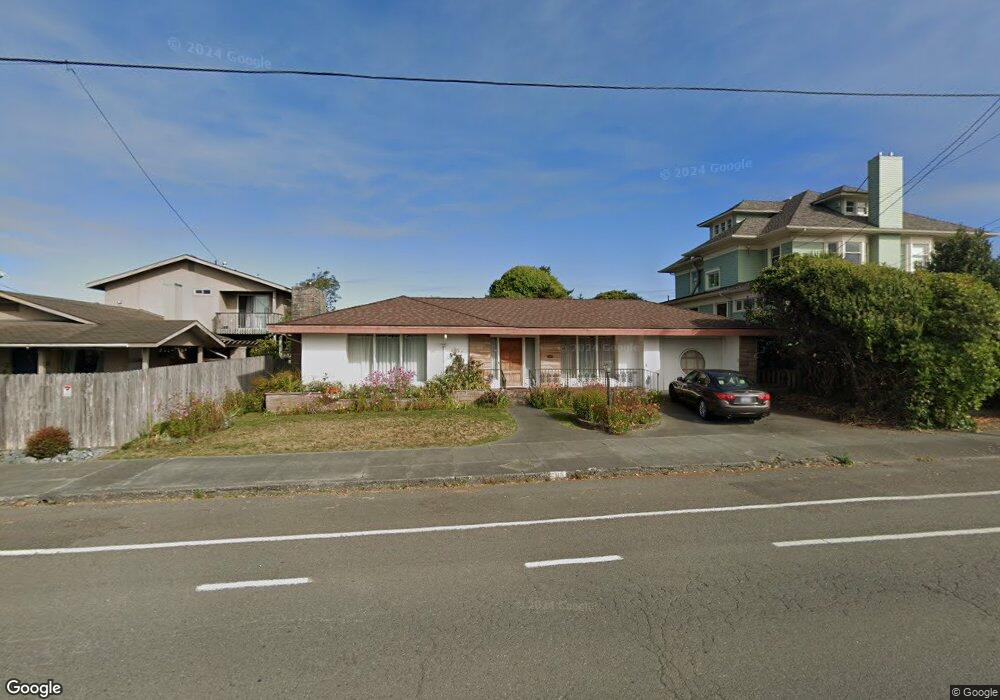
915 J St Eureka, CA 95501
City Center NeighborhoodEstimated Value: $410,949 - $509,000
2
Beds
1
Bath
2,200
Sq Ft
$205/Sq Ft
Est. Value
About This Home
This home is located at 915 J St, Eureka, CA 95501 and is currently estimated at $451,487, approximately $205 per square foot. 915 J St is a home located in Humboldt County with nearby schools including Washington Elementary School, Catherine L. Zane Middle School, and Eureka Senior High School.
Ownership History
Date
Name
Owned For
Owner Type
Purchase Details
Closed on
Oct 21, 2021
Sold by
Johnson Rolland S
Bought by
Johnson Rolland S and Johnson Lilette
Current Estimated Value
Purchase Details
Closed on
Mar 17, 1998
Sold by
Sosinski Stephan J and Sosinski Patricia Lynn
Bought by
Johnson Rolland S
Home Financials for this Owner
Home Financials are based on the most recent Mortgage that was taken out on this home.
Original Mortgage
$87,000
Interest Rate
7.06%
Purchase Details
Closed on
Mar 5, 1998
Sold by
Johnson Lilette
Bought by
Johnson Rolland S
Home Financials for this Owner
Home Financials are based on the most recent Mortgage that was taken out on this home.
Original Mortgage
$87,000
Interest Rate
7.06%
Create a Home Valuation Report for This Property
The Home Valuation Report is an in-depth analysis detailing your home's value as well as a comparison with similar homes in the area
Home Values in the Area
Average Home Value in this Area
Purchase History
| Date | Buyer | Sale Price | Title Company |
|---|---|---|---|
| Johnson Rolland S | -- | None Available | |
| Johnson Rolland S | $147,000 | Fidelity National Title Co | |
| Johnson Rolland S | -- | Fidelity National Title Co |
Source: Public Records
Mortgage History
| Date | Status | Borrower | Loan Amount |
|---|---|---|---|
| Previous Owner | Johnson Rolland S | $87,000 |
Source: Public Records
Tax History
| Year | Tax Paid | Tax Assessment Tax Assessment Total Assessment is a certain percentage of the fair market value that is determined by local assessors to be the total taxable value of land and additions on the property. | Land | Improvement |
|---|---|---|---|---|
| 2025 | $2,340 | $234,698 | $71,841 | $162,857 |
| 2024 | $2,340 | $230,097 | $70,433 | $159,664 |
| 2023 | $2,306 | $225,586 | $69,052 | $156,534 |
| 2022 | $2,392 | $221,164 | $67,699 | $153,465 |
| 2021 | $2,239 | $216,828 | $66,372 | $150,456 |
| 2020 | $2,221 | $214,606 | $65,692 | $148,914 |
| 2019 | $2,174 | $210,399 | $64,404 | $145,995 |
| 2018 | $2,140 | $206,275 | $63,142 | $143,133 |
| 2017 | $2,128 | $202,231 | $61,904 | $140,327 |
| 2016 | $2,127 | $198,267 | $60,691 | $137,576 |
| 2015 | $2,107 | $195,290 | $59,780 | $135,510 |
| 2014 | $1,968 | $191,465 | $58,609 | $132,856 |
Source: Public Records
Map
Nearby Homes
Your Personal Tour Guide
Ask me questions while you tour the home.