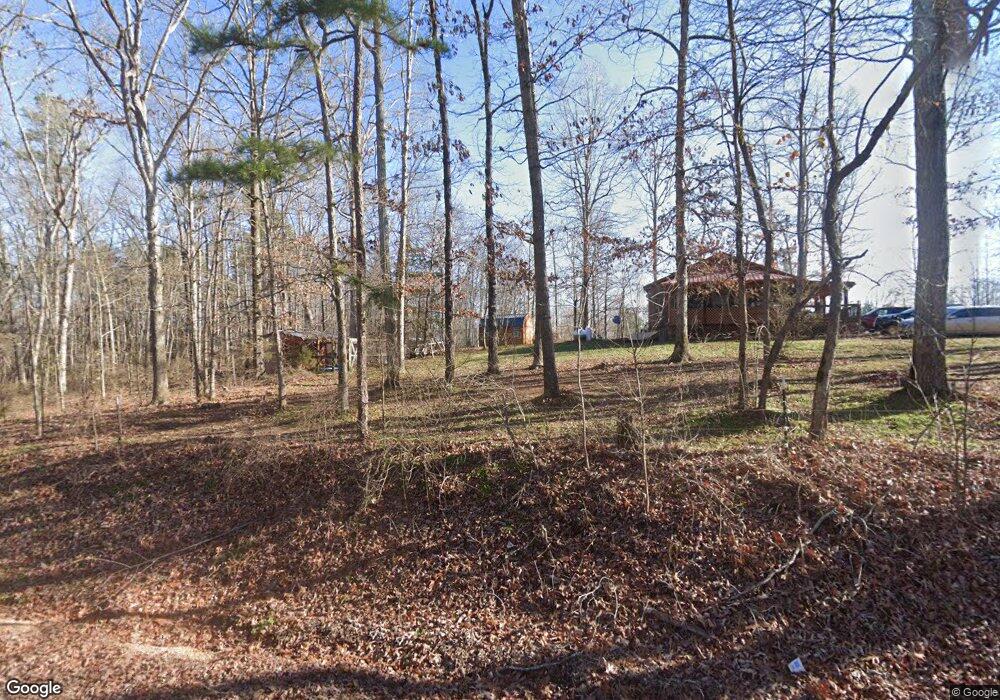
915 Joanne Loop Savannah, TN 38372
Estimated Value: $172,690 - $257,000
--
Bed
1
Bath
1,120
Sq Ft
$179/Sq Ft
Est. Value
About This Home
This home is located at 915 Joanne Loop, Savannah, TN 38372 and is currently estimated at $200,173, approximately $178 per square foot. 915 Joanne Loop is a home located in Hardin County with nearby schools including Hardin County High School.
Ownership History
Date
Name
Owned For
Owner Type
Purchase Details
Closed on
Apr 28, 2016
Sold by
Franks Ronnie L
Bought by
Franks E J
Current Estimated Value
Purchase Details
Closed on
Dec 23, 2014
Sold by
Franks Ronnie
Bought by
Stevens Deana
Purchase Details
Closed on
Jan 31, 2014
Sold by
Franks Ronnie L
Bought by
Booher Daniel P
Purchase Details
Closed on
Jul 29, 2005
Bought by
Franks Ronnie and Franks Teresa
Purchase Details
Closed on
Aug 19, 1999
Sold by
Leon Easley
Bought by
Burton Raymond F and Burton Doris H
Purchase Details
Closed on
Jun 10, 1999
Bought by
Burton Raymond F and Burton Doris H
Purchase Details
Closed on
Dec 31, 1991
Bought by
Easley Leon
Purchase Details
Closed on
Dec 11, 1990
Bought by
Easley Leon & Hardin County Bancshares
Purchase Details
Closed on
Mar 7, 1986
Bought by
Easley Leon & Hardin County Bank
Purchase Details
Closed on
Jun 16, 1977
Purchase Details
Closed on
May 14, 1977
Create a Home Valuation Report for This Property
The Home Valuation Report is an in-depth analysis detailing your home's value as well as a comparison with similar homes in the area
Home Values in the Area
Average Home Value in this Area
Purchase History
| Date | Buyer | Sale Price | Title Company |
|---|---|---|---|
| Franks E J | $36,000 | -- | |
| Stevens Deana | $77,500 | -- | |
| Booher Daniel P | $9,000 | -- | |
| Franks Ronnie | $9,000 | -- | |
| Burton Raymond F | $2,800 | -- | |
| Burton Raymond F | $2,800 | -- | |
| Easley Leon | -- | -- | |
| Easley Leon & Hardin County Bancshares | -- | -- | |
| Easley Leon & Hardin County Bank | -- | -- | |
| -- | -- | -- | |
| -- | -- | -- |
Source: Public Records
Tax History Compared to Growth
Tax History
| Year | Tax Paid | Tax Assessment Tax Assessment Total Assessment is a certain percentage of the fair market value that is determined by local assessors to be the total taxable value of land and additions on the property. | Land | Improvement |
|---|---|---|---|---|
| 2024 | $615 | $35,125 | $1,625 | $33,500 |
| 2023 | $615 | $35,125 | $1,625 | $33,500 |
| 2022 | $496 | $24,100 | $750 | $23,350 |
| 2021 | $478 | $24,100 | $750 | $23,350 |
| 2020 | $478 | $23,225 | $750 | $22,475 |
| 2019 | $478 | $23,225 | $750 | $22,475 |
| 2018 | $462 | $23,225 | $750 | $22,475 |
| 2017 | $418 | $20,100 | $750 | $19,350 |
| 2016 | $418 | $20,100 | $750 | $19,350 |
| 2015 | $366 | $20,100 | $750 | $19,350 |
| 2014 | $366 | $20,100 | $750 | $19,350 |
Source: Public Records
Map
Nearby Homes
- 0059 Joanne Loop
- 0058 Joanne Loop
- 0061 Joanne Loop
- 0060 Joanne Loop
- 0 Bruton Branch Rd Unit 10140169
- 0 Pompeys Branch Rd Unit 10177943
- 1 Bruton Rd
- 1405 Bruton Branch Rd
- 24 Bruton Branch Rd
- 1 Lakeway Ln
- 535 Megan Ln
- 410 Megan Ln
- 2125 Bruton Branch Rd
- 0 Preserve Blvd Unit 24433230
- 94 Preserve Blvd
- LOT 296 Tuscany Point
- LOT #291 Destiny Way
- LOT 274 & 275 Secluded Loop
- LOT 256 Stone Hill Loop
- LOT 257 Stone Hill Loop
- 915 Joanne Loop
- 915 Joanne Loop
- 915 Joanne Loop
- 915 Joanne Loop
- 901 Joanne Loop
- 125 Joanne Loop
- 2095 Bruton Rd
- 155 Joanne Loop
- 3 Wheeler Dr at Joanne Loop
- 836 Joanne Loop
- LOTS 16 & 17 Joanne Loop
- 000 Joanne Loop
- 00 Joanne Loop
- 67 Joanne Loop
- 2045 Bruton Rd
- 0 Bruton Branch Rd Unit 10032224
- 0 Bruton Branch Rd Unit 3169387
- 0 Bruton Branch Rd Unit 3197476
- 0 Bruton Branch Rd Unit 3222179
- 0 Bruton Branch Rd Unit 3268980