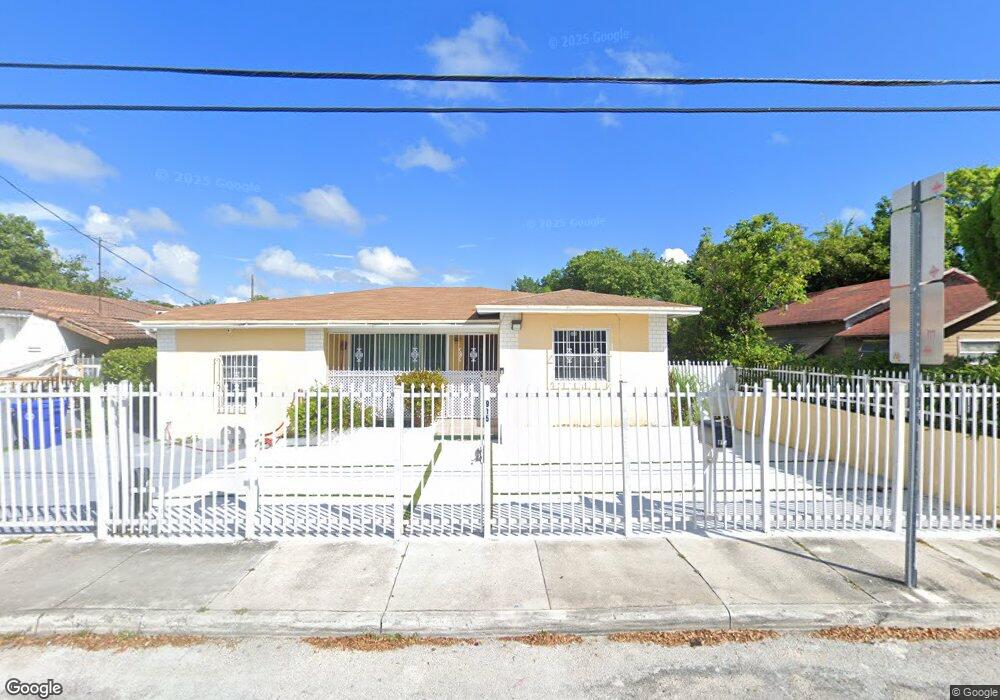
915 NW 30th St Miami, FL 33127
Allapattah NeighborhoodEstimated Value: $558,000 - $585,000
3
Beds
2
Baths
2,260
Sq Ft
$252/Sq Ft
Est. Value
About This Home
This home is located at 915 NW 30th St, Miami, FL 33127 and is currently estimated at $569,800, approximately $252 per square foot. 915 NW 30th St is a home located in Miami-Dade County with nearby schools including Santa Clara Elementary School, Georgia Jones Ayers Middle School, and Miami Jackson Senior High School.
Ownership History
Date
Name
Owned For
Owner Type
Purchase Details
Closed on
Dec 23, 2025
Sold by
Rose Joachim and Rose Gelin Rose
Bought by
Rose Joachim Revocable Trust and Joachim
Current Estimated Value
Purchase Details
Closed on
May 11, 2018
Sold by
Jerome Yvon
Bought by
Gelin Rose M and Gelin Rose M Jean
Purchase Details
Closed on
Mar 22, 2018
Sold by
Gelin Rose and Jerome Yvon
Bought by
Gelin Rose
Purchase Details
Closed on
Sep 13, 2005
Sold by
Jean Charles Rose Marie
Bought by
Jean Charles Rose Marie and Jerome Yvon
Purchase Details
Closed on
Jul 6, 2005
Sold by
Jean Charles Renold
Bought by
Jean Charles Rose Marie
Purchase Details
Closed on
Dec 3, 1999
Sold by
Charles Renold J
Bought by
Charles Renold J and Charles Rose M
Purchase Details
Closed on
Dec 22, 1993
Sold by
Newman Geleta and King Christina
Bought by
Charles Renold Jean
Home Financials for this Owner
Home Financials are based on the most recent Mortgage that was taken out on this home.
Original Mortgage
$75,190
Interest Rate
7.09%
Mortgage Type
FHA
Create a Home Valuation Report for This Property
The Home Valuation Report is an in-depth analysis detailing your home's value as well as a comparison with similar homes in the area
Home Values in the Area
Average Home Value in this Area
Purchase History
| Date | Buyer | Sale Price | Title Company |
|---|---|---|---|
| Rose Joachim Revocable Trust | -- | None Listed On Document | |
| Gelin Rose M | -- | None Available | |
| Gelin Rose | -- | Attorney | |
| Jean Charles Rose Marie | $30,000 | -- | |
| Jean Charles Rose Marie | -- | -- | |
| Charles Renold J | $35,500 | -- | |
| Charles Renold Jean | $75,000 | -- |
Source: Public Records
Mortgage History
| Date | Status | Borrower | Loan Amount |
|---|---|---|---|
| Previous Owner | Charles Renold Jean | $75,190 |
Source: Public Records
Tax History
| Year | Tax Paid | Tax Assessment Tax Assessment Total Assessment is a certain percentage of the fair market value that is determined by local assessors to be the total taxable value of land and additions on the property. | Land | Improvement |
|---|---|---|---|---|
| 2025 | $2,991 | $119,776 | -- | -- |
| 2024 | $2,927 | $112,499 | -- | -- |
| 2023 | $2,927 | $105,729 | $0 | $0 |
| 2022 | $2,742 | $99,474 | $0 | $0 |
| 2021 | $2,480 | $90,590 | $0 | $0 |
| 2020 | $2,027 | $130,918 | $0 | $0 |
| 2019 | $1,882 | $119,173 | $0 | $0 |
| 2018 | $1,758 | $114,973 | $0 | $0 |
| 2017 | $1,648 | $73,817 | $0 | $0 |
| 2016 | $1,560 | $70,302 | $0 | $0 |
| 2015 | $1,589 | $67,646 | $0 | $0 |
| 2014 | $1,535 | $65,163 | $0 | $0 |
Source: Public Records
Map
Nearby Homes
- 1009 NW 31 St
- 1037 NW 30th St
- 1041 NW 30th St
- 800 NW 29th Terrace
- 2900 NW 10th Ave
- 3300 NW 10th Ave
- 1075 NW 30th St
- 737 NW 30th St
- 3314 NW 8th Ave
- 1044 NW 29th St
- 1101 NW 30th St
- 1054 NW 29th St
- 1120 NW 31st St
- 3221 NW 11th Ct
- 727 NW 29th St
- 773 NW 34th St
- 660,662,664 NW 29th St
- 1177 NW 30th St
- 683 & 681 & 679 NW 30th St
- 683 NW 30th St
- 3014 NW 10th Ave
- 905 NW 30th St
- 3011 NW 10th Ave
- 901 NW 30th St
- 3020 NW 9th Ave
- 3000 NW 10th Ave
- 3030 NW 9th Ave
- 3035 NW 10th Ave
- 913 NW 29th Terrace
- 3001 NW 9th Ave
- 919 NW 29th Terrace
- 3010 NW 10th Ave
- 3041 NW 10th Ave Unit F
- 911 NW 29th Terrace
- 3040 NW 9th Ave
- 3015 NW 9th Ave
- 3022 NW 10th Ave
- 1021 NW 30th St
- 881 NW 30th St
Your Personal Tour Guide
Ask me questions while you tour the home.