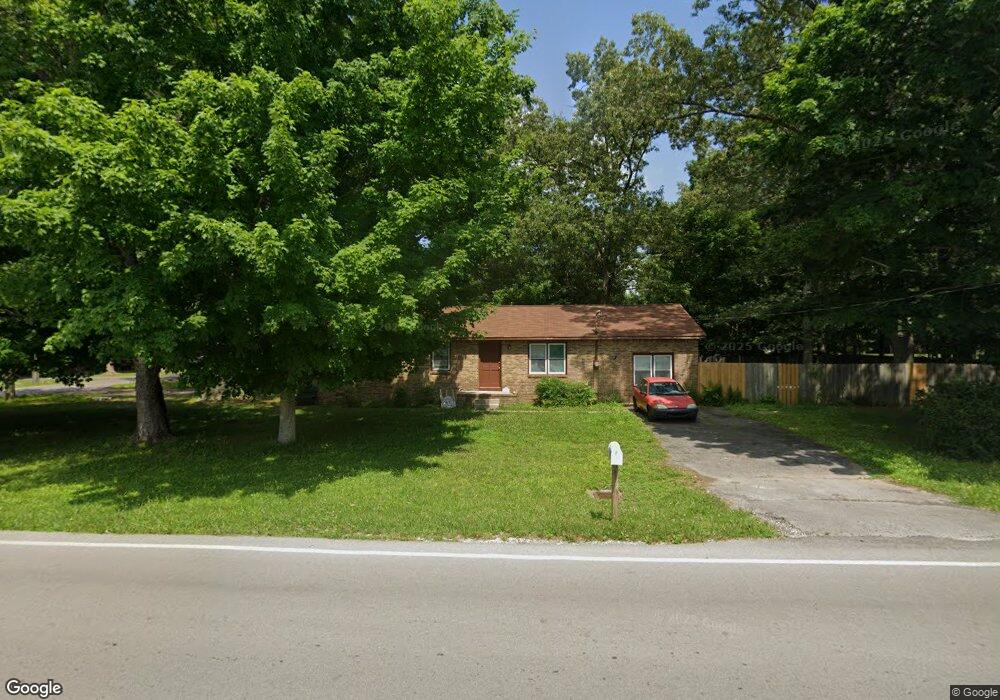
915 Oakdale St Manchester, TN 37355
Estimated Value: $166,989 - $233,000
--
Bed
1
Bath
1,500
Sq Ft
$142/Sq Ft
Est. Value
About This Home
This home is located at 915 Oakdale St, Manchester, TN 37355 and is currently estimated at $212,497, approximately $141 per square foot. 915 Oakdale St is a home located in Coffee County with nearby schools including Westwood Middle School and Temple Baptist Christian School.
Ownership History
Date
Name
Owned For
Owner Type
Purchase Details
Closed on
Jun 19, 2006
Sold by
Elrod Kristopher Shawn
Bought by
U S Bank N A
Current Estimated Value
Purchase Details
Closed on
Oct 3, 2001
Sold by
Loveless Ben
Bought by
Elrod Kristopher S and Elrod April
Home Financials for this Owner
Home Financials are based on the most recent Mortgage that was taken out on this home.
Original Mortgage
$82,900
Interest Rate
6.87%
Purchase Details
Closed on
Jul 12, 1996
Sold by
Cantrell Carl D
Bought by
Loveless Ben
Create a Home Valuation Report for This Property
The Home Valuation Report is an in-depth analysis detailing your home's value as well as a comparison with similar homes in the area
Home Values in the Area
Average Home Value in this Area
Purchase History
| Date | Buyer | Sale Price | Title Company |
|---|---|---|---|
| U S Bank N A | $85,596 | -- | |
| Elrod Kristopher S | $80,500 | -- | |
| Loveless Ben | $63,000 | -- |
Source: Public Records
Mortgage History
| Date | Status | Borrower | Loan Amount |
|---|---|---|---|
| Previous Owner | Loveless Ben | $82,900 |
Source: Public Records
Tax History Compared to Growth
Tax History
| Year | Tax Paid | Tax Assessment Tax Assessment Total Assessment is a certain percentage of the fair market value that is determined by local assessors to be the total taxable value of land and additions on the property. | Land | Improvement |
|---|---|---|---|---|
| 2024 | $1,146 | $27,200 | $2,000 | $25,200 |
| 2023 | $1,146 | $27,200 | $0 | $0 |
| 2022 | $987 | $27,200 | $2,000 | $25,200 |
| 2021 | $973 | $21,250 | $2,000 | $19,250 |
| 2020 | $973 | $21,250 | $2,000 | $19,250 |
| 2019 | $973 | $21,250 | $2,000 | $19,250 |
| 2018 | $973 | $21,250 | $2,000 | $19,250 |
| 2017 | $1,028 | $19,600 | $2,000 | $17,600 |
| 2016 | $1,028 | $19,600 | $2,000 | $17,600 |
| 2015 | $1,028 | $19,600 | $2,000 | $17,600 |
| 2014 | $1,028 | $19,601 | $0 | $0 |
Source: Public Records
Map
Nearby Homes