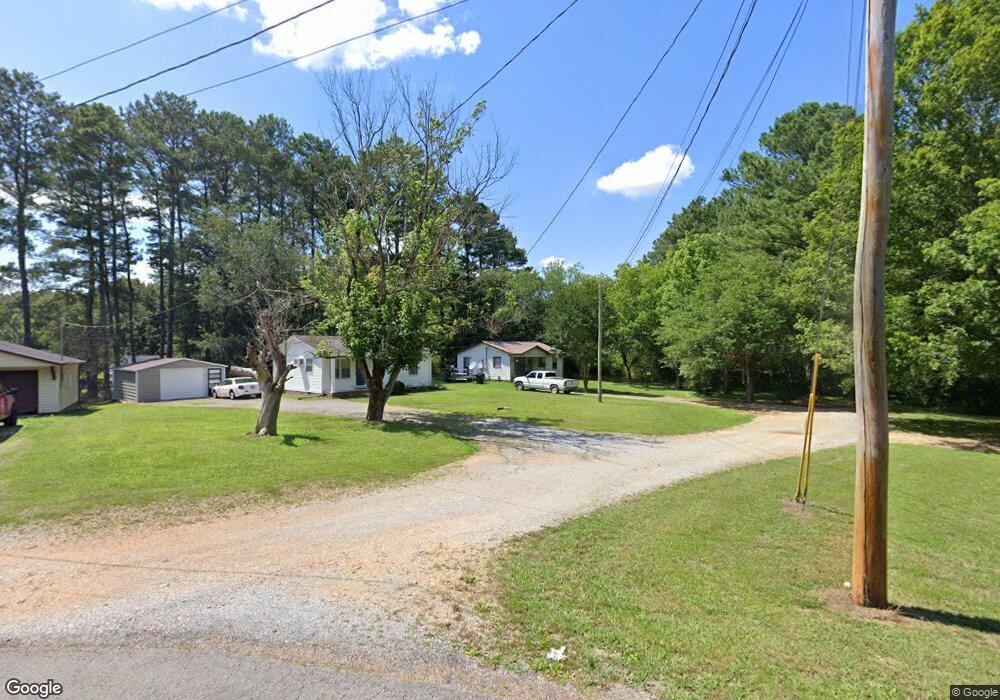
915 Rosier Rd Lawrenceburg, TN 38464
Estimated Value: $81,000 - $189,000
--
Bed
1
Bath
768
Sq Ft
$171/Sq Ft
Est. Value
About This Home
This home is located at 915 Rosier Rd, Lawrenceburg, TN 38464 and is currently estimated at $131,463, approximately $171 per square foot. 915 Rosier Rd is a home located in Lawrence County with nearby schools including Lawrenceburg Public Elementary School, Ingram Sowell Elementary School, and David Crockett Elementary School.
Ownership History
Date
Name
Owned For
Owner Type
Purchase Details
Closed on
Sep 23, 2016
Sold by
Chaney Victoria Grace
Bought by
Clark Jeffrey L and Clark Kristy A
Current Estimated Value
Home Financials for this Owner
Home Financials are based on the most recent Mortgage that was taken out on this home.
Original Mortgage
$22,800
Outstanding Balance
$2,647
Interest Rate
3.43%
Mortgage Type
Purchase Money Mortgage
Estimated Equity
$128,816
Purchase Details
Closed on
Jan 22, 2014
Sold by
Brown Ed
Bought by
Chaney Victoria Grace and Chaney Linda J
Purchase Details
Closed on
Jul 8, 2010
Sold by
Barnett Danny Wayne
Bought by
Brown Ed
Purchase Details
Closed on
Oct 30, 2006
Bought by
Barnett Danny C
Purchase Details
Closed on
May 28, 1993
Bought by
Farmers Home Adm U S Of America
Purchase Details
Closed on
Nov 8, 1983
Bought by
Hartsfield Winston and Hartsfield Earline
Purchase Details
Closed on
Jan 1, 1983
Purchase Details
Closed on
Jan 1, 1981
Create a Home Valuation Report for This Property
The Home Valuation Report is an in-depth analysis detailing your home's value as well as a comparison with similar homes in the area
Home Values in the Area
Average Home Value in this Area
Purchase History
| Date | Buyer | Sale Price | Title Company |
|---|---|---|---|
| Clark Jeffrey L | $28,500 | -- | |
| Chaney Victoria Grace | $20,000 | -- | |
| Brown Ed | $20,000 | -- | |
| Barnett Danny C | -- | -- | |
| Farmers Home Adm U S Of America | -- | -- | |
| Hartsfield Winston | -- | -- | |
| -- | $22,500 | -- | |
| -- | $23,000 | -- |
Source: Public Records
Mortgage History
| Date | Status | Borrower | Loan Amount |
|---|---|---|---|
| Open | Clark Jeffrey L | $22,800 |
Source: Public Records
Tax History Compared to Growth
Tax History
| Year | Tax Paid | Tax Assessment Tax Assessment Total Assessment is a certain percentage of the fair market value that is determined by local assessors to be the total taxable value of land and additions on the property. | Land | Improvement |
|---|---|---|---|---|
| 2025 | $354 | $17,625 | $0 | $0 |
| 2024 | $354 | $17,625 | $2,725 | $14,900 |
| 2023 | $354 | $17,625 | $2,725 | $14,900 |
| 2022 | $354 | $17,625 | $2,725 | $14,900 |
| 2021 | $245 | $8,275 | $1,575 | $6,700 |
| 2020 | $245 | $8,275 | $1,575 | $6,700 |
| 2019 | $245 | $8,275 | $1,575 | $6,700 |
| 2018 | $245 | $8,275 | $1,575 | $6,700 |
| 2017 | $245 | $8,275 | $1,575 | $6,700 |
| 2016 | $245 | $8,275 | $1,575 | $6,700 |
| 2015 | $227 | $8,275 | $1,575 | $6,700 |
| 2014 | $233 | $8,500 | $1,575 | $6,925 |
Source: Public Records
Map
Nearby Homes
- 905 Rosier Rd
- 1240 Fall River Rd
- 1210 Fall River Rd
- 935 Rosier Rd
- 1015 Rosier Rd
- 1005 Rosier Rd
- 1116 Fall River Rd
- 1117 Hickory St
- 1113 Hickory St
- 1116 Hickory St
- 1020 Rosier Rd
- 1030 Rosier Rd
- 1010 Rosier Rd
- 1040 Rosier Rd
- 1112 Fall River Rd
- 1113 Fall River
- 1113 Fall River Rd
- 1050 Rosier Rd
- 1111 Hickory St
- 1060 Rosier Rd