Estimated Value: $598,376
--
Bed
--
Bath
--
Sq Ft
--
Built
About This Home
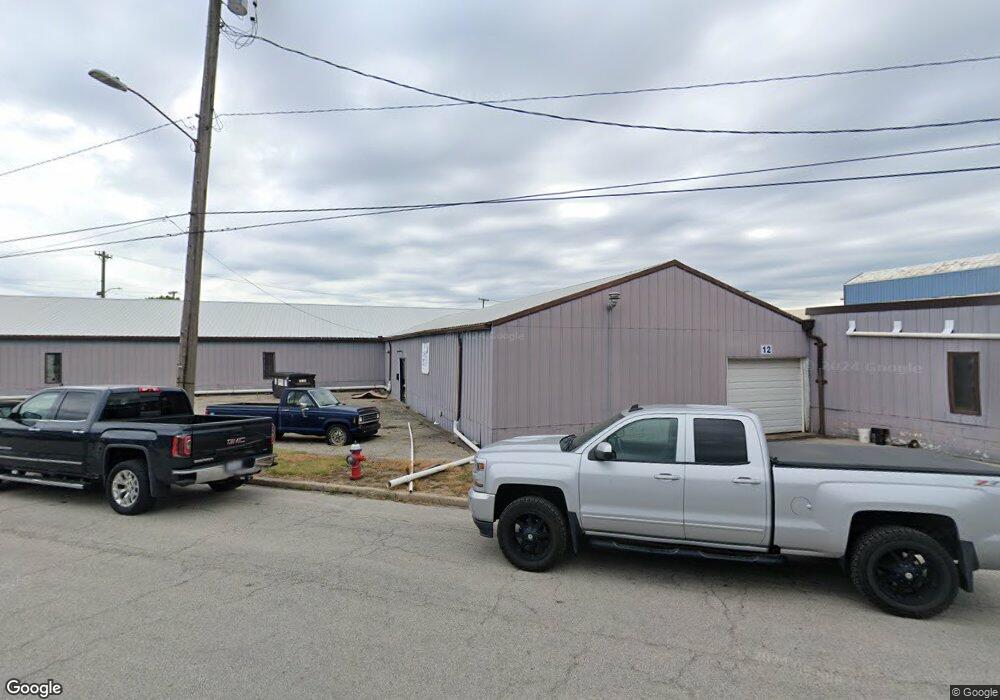
This home is located at 915 S Downing St, Piqua, OH 45356 and is currently estimated at $598,376. 915 S Downing St is a home located in Miami County with nearby schools including Piqua Junior High School, Piqua High School, and Nicholas School.
Ownership History
Date
Name
Owned For
Owner Type
Purchase Details
Closed on
Nov 4, 2016
Sold by
Intrinsic Commercial Storage Llc
Bought by
Piqua Men Of Steel Llc
Current Estimated Value
Home Financials for this Owner
Home Financials are based on the most recent Mortgage that was taken out on this home.
Original Mortgage
$249,000
Outstanding Balance
$33,618
Interest Rate
3.42%
Mortgage Type
Commercial
Estimated Equity
$564,758
Purchase Details
Closed on
Jan 31, 2014
Sold by
Magel Eric D and Magel Amy R
Bought by
Intrinsic Commercial Storage Llc
Purchase Details
Closed on
Oct 1, 1980
Bought by
Pei Inc
Create a Home Valuation Report for This Property
The Home Valuation Report is an in-depth analysis detailing your home's value as well as a comparison with similar homes in the area
Home Values in the Area
Average Home Value in this Area
Purchase History
| Date | Buyer | Sale Price | Title Company |
|---|---|---|---|
| Piqua Men Of Steel Llc | $300,000 | Attorney | |
| Intrinsic Commercial Storage Llc | -- | Attorney | |
| Pei Inc | $165,000 | -- |
Source: Public Records
Mortgage History
| Date | Status | Borrower | Loan Amount |
|---|---|---|---|
| Open | Piqua Men Of Steel Llc | $249,000 |
Source: Public Records
Tax History Compared to Growth
Tax History
| Year | Tax Paid | Tax Assessment Tax Assessment Total Assessment is a certain percentage of the fair market value that is determined by local assessors to be the total taxable value of land and additions on the property. | Land | Improvement |
|---|---|---|---|---|
| 2024 | $5,881 | $94,750 | $18,030 | $76,720 |
| 2023 | $5,881 | $94,750 | $18,030 | $76,720 |
| 2022 | $5,854 | $94,750 | $18,030 | $76,720 |
| 2021 | $5,917 | $94,750 | $18,030 | $76,720 |
| 2020 | $5,866 | $94,750 | $18,030 | $76,720 |
| 2019 | $5,867 | $94,750 | $18,030 | $76,720 |
| 2018 | $3,059 | $49,010 | $20,060 | $28,950 |
| 2017 | $3,085 | $49,010 | $20,060 | $28,950 |
| 2016 | $3,060 | $49,010 | $20,060 | $28,950 |
| 2015 | $2,974 | $49,010 | $20,060 | $28,950 |
| 2014 | $2,974 | $49,010 | $20,060 | $28,950 |
| 2013 | $5,629 | $95,140 | $40,150 | $54,990 |
Source: Public Records
Map
Nearby Homes