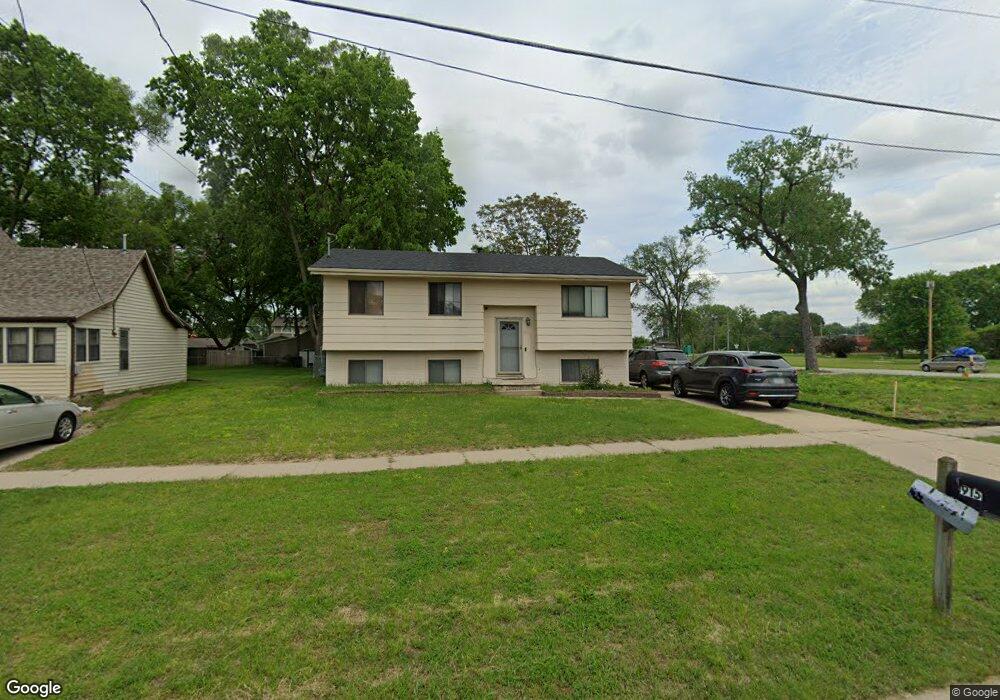
915 SE 11th St Des Moines, IA 50309
East Village NeighborhoodEstimated Value: $176,149 - $227,000
--
Bed
1
Bath
894
Sq Ft
$220/Sq Ft
Est. Value
About This Home
This home is located at 915 SE 11th St, Des Moines, IA 50309 and is currently estimated at $196,787, approximately $220 per square foot. 915 SE 11th St is a home located in Polk County with nearby schools including Capitol View Elementary School, Hiatt Middle School, and East High School.
Ownership History
Date
Name
Owned For
Owner Type
Purchase Details
Closed on
Mar 22, 2014
Sold by
Vongxay Bounxom
Bought by
Vongxay Vi and Vongxay Charlie
Current Estimated Value
Purchase Details
Closed on
Mar 8, 1999
Sold by
Vongxay Bounxom and Vongxay Vong
Bought by
Vongxay Bounxom and Vongxay Vong
Home Financials for this Owner
Home Financials are based on the most recent Mortgage that was taken out on this home.
Original Mortgage
$58,500
Interest Rate
6.8%
Create a Home Valuation Report for This Property
The Home Valuation Report is an in-depth analysis detailing your home's value as well as a comparison with similar homes in the area
Home Values in the Area
Average Home Value in this Area
Purchase History
| Date | Buyer | Sale Price | Title Company |
|---|---|---|---|
| Vongxay Vi | -- | None Available | |
| Vongxay Bounxom | -- | -- |
Source: Public Records
Mortgage History
| Date | Status | Borrower | Loan Amount |
|---|---|---|---|
| Closed | Vongxay Bounxom | $58,500 |
Source: Public Records
Tax History Compared to Growth
Tax History
| Year | Tax Paid | Tax Assessment Tax Assessment Total Assessment is a certain percentage of the fair market value that is determined by local assessors to be the total taxable value of land and additions on the property. | Land | Improvement |
|---|---|---|---|---|
| 2024 | $3,070 | $156,100 | $17,300 | $138,800 |
| 2023 | $3,092 | $156,100 | $17,300 | $138,800 |
| 2022 | $3,068 | $131,200 | $15,200 | $116,000 |
| 2021 | $3,072 | $131,200 | $15,200 | $116,000 |
| 2020 | $3,192 | $123,100 | $14,200 | $108,900 |
| 2019 | $3,140 | $123,100 | $14,200 | $108,900 |
| 2018 | $3,108 | $116,800 | $13,200 | $103,600 |
| 2017 | $3,004 | $116,800 | $13,200 | $103,600 |
| 2016 | $2,928 | $111,100 | $12,300 | $98,800 |
| 2015 | $2,928 | $111,100 | $12,300 | $98,800 |
| 2014 | $2,858 | $107,600 | $11,500 | $96,100 |
Source: Public Records
Map
Nearby Homes
- 823 SE 11th St
- 819 SE 11th St
- 815 SE 11th St
- 811 SE 11th St
- 905 Shaw St
- 825 SE 8th St
- 525 SE 9th St
- 821 E Jackson Ave
- 816 E Dunham Ave
- 808 E Dunham Ave
- 814 E Edison Ave
- 800 E Edison Ave
- 816 E Edison Ave
- 818 E Edison Ave
- 104 E 15th St
- 436 E Granger Ave
- 913 E Hillside Ave
- 409 E Granger Ave
- 405 E Granger Ave
- 317 E Jackson Ave
- 911 SE 11th St
- 919 SE 11th St
- 907 SE 11th St
- 906 SE 12th St
- 914 SE 12th St
- 900 SE 12th St
- 814 SE 11th St
- 822 SE 12th St
- 818 SE 12th St
- 812 SE 11th St
- 810 SE 11th St
- 808 SE 11th St
- 813 SE 10th St
- 1103 Maury St
- 811 SE 10th St
- 806 SE 11th St
- 911 SE 14th St
- 809 SE 10th St
- 923 E Railroad Ave
- 807 SE 10th St