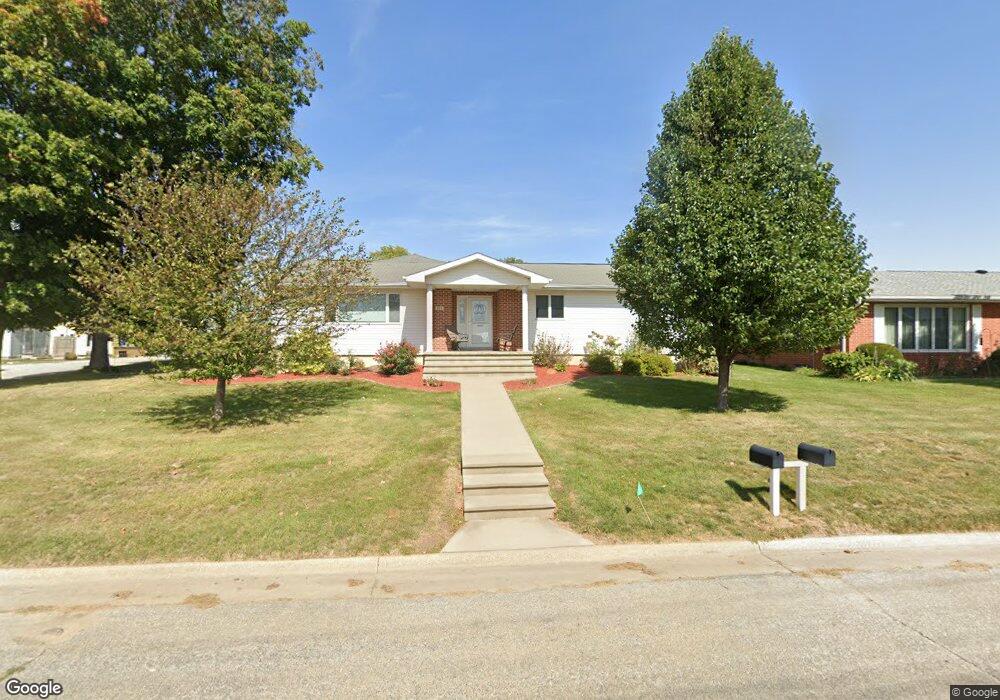
915 W 16th St Vinton, IA 52349
Estimated Value: $276,000 - $367,000
3
Beds
2
Baths
1,735
Sq Ft
$176/Sq Ft
Est. Value
About This Home
This home is located at 915 W 16th St, Vinton, IA 52349 and is currently estimated at $305,083, approximately $175 per square foot. 915 W 16th St is a home located in Benton County with nearby schools including Tilford Elementary School, Shellsburg Elementary School, and Vinton-Shellsburg Middle School.
Ownership History
Date
Name
Owned For
Owner Type
Purchase Details
Closed on
Jun 12, 2012
Sold by
Ockenfels Eric J and Ockenfels Kathy L
Bought by
Melsa Greg A
Current Estimated Value
Home Financials for this Owner
Home Financials are based on the most recent Mortgage that was taken out on this home.
Original Mortgage
$161,200
Outstanding Balance
$111,927
Interest Rate
3.87%
Mortgage Type
New Conventional
Estimated Equity
$193,156
Create a Home Valuation Report for This Property
The Home Valuation Report is an in-depth analysis detailing your home's value as well as a comparison with similar homes in the area
Home Values in the Area
Average Home Value in this Area
Purchase History
| Date | Buyer | Sale Price | Title Company |
|---|---|---|---|
| Melsa Greg A | $201,500 | None Available |
Source: Public Records
Mortgage History
| Date | Status | Borrower | Loan Amount |
|---|---|---|---|
| Open | Melsa Greg A | $161,200 |
Source: Public Records
Tax History Compared to Growth
Tax History
| Year | Tax Paid | Tax Assessment Tax Assessment Total Assessment is a certain percentage of the fair market value that is determined by local assessors to be the total taxable value of land and additions on the property. | Land | Improvement |
|---|---|---|---|---|
| 2025 | $4,666 | $284,200 | $19,500 | $264,700 |
| 2024 | $4,666 | $259,200 | $19,100 | $240,100 |
| 2023 | $4,402 | $259,200 | $19,100 | $240,100 |
| 2022 | $4,516 | $213,400 | $15,300 | $198,100 |
| 2021 | $4,516 | $213,400 | $15,300 | $198,100 |
| 2020 | $3,966 | $192,100 | $12,400 | $179,700 |
| 2019 | $3,986 | $192,100 | $12,400 | $179,700 |
| 2018 | $3,868 | $190,400 | $11,800 | $178,600 |
| 2017 | $3,868 | $190,400 | $11,800 | $178,600 |
| 2016 | $3,534 | $172,500 | $11,000 | $161,500 |
| 2015 | $3,534 | $172,500 | $11,000 | $161,500 |
| 2014 | $3,854 | $186,900 | $0 | $0 |
Source: Public Records
Map
Nearby Homes