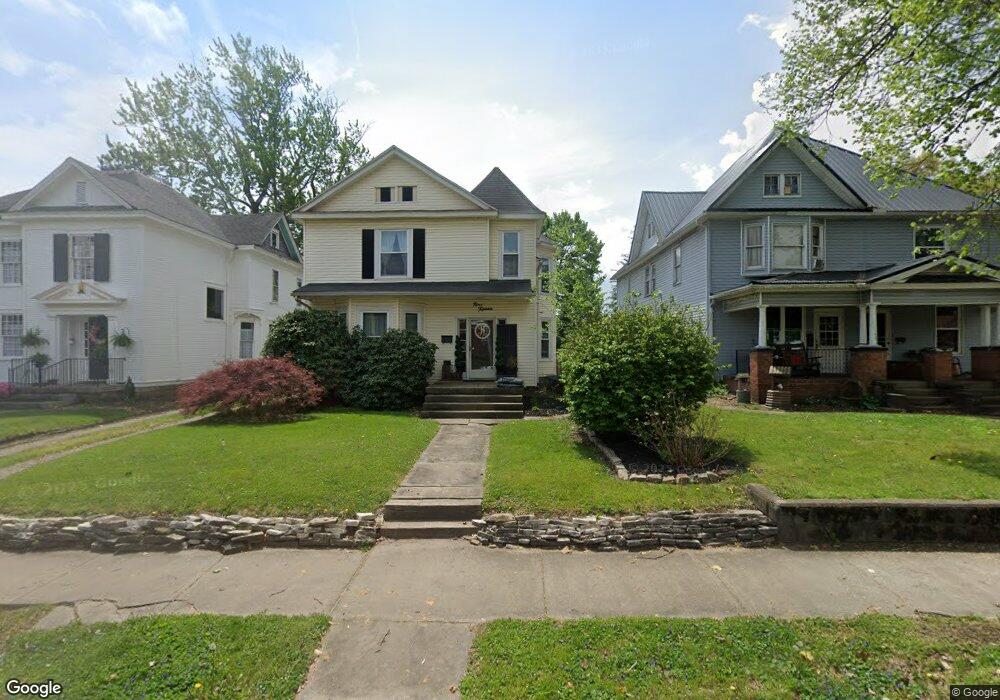
915 Walnut St Coshocton, OH 43812
Estimated Value: $123,000 - $143,823
3
Beds
1
Bath
2,106
Sq Ft
$63/Sq Ft
Est. Value
About This Home
This home is located at 915 Walnut St, Coshocton, OH 43812 and is currently estimated at $132,206, approximately $62 per square foot. 915 Walnut St is a home located in Coshocton County with nearby schools including Coshocton High School, Coshocton Opportunity School, and Sacred Heart Elementary School.
Ownership History
Date
Name
Owned For
Owner Type
Purchase Details
Closed on
Sep 1, 1999
Sold by
Callahan Jeanne Davis
Bought by
Callahan Jeanne Davis Family
Current Estimated Value
Home Financials for this Owner
Home Financials are based on the most recent Mortgage that was taken out on this home.
Original Mortgage
$75,216
Interest Rate
6.69%
Mortgage Type
Credit Line Revolving
Purchase Details
Closed on
Aug 26, 1999
Sold by
Jeanne David Callahan Family Trust
Bought by
Haley Richard R
Home Financials for this Owner
Home Financials are based on the most recent Mortgage that was taken out on this home.
Original Mortgage
$75,216
Interest Rate
6.69%
Mortgage Type
Credit Line Revolving
Purchase Details
Closed on
Aug 5, 1997
Sold by
Lenhart Sue
Bought by
Lenhart Sue
Purchase Details
Closed on
Jul 24, 1997
Sold by
Cesa James W
Bought by
Lenhart Sue
Create a Home Valuation Report for This Property
The Home Valuation Report is an in-depth analysis detailing your home's value as well as a comparison with similar homes in the area
Home Values in the Area
Average Home Value in this Area
Purchase History
| Date | Buyer | Sale Price | Title Company |
|---|---|---|---|
| Callahan Jeanne Davis Family | -- | -- | |
| Haley Richard R | $84,800 | Fidelity National Title | |
| Lenhart Sue | $67,500 | -- | |
| Lenhart Sue | $67,500 | -- |
Source: Public Records
Mortgage History
| Date | Status | Borrower | Loan Amount |
|---|---|---|---|
| Previous Owner | Haley Richard R | $75,216 |
Source: Public Records
Tax History
| Year | Tax Paid | Tax Assessment Tax Assessment Total Assessment is a certain percentage of the fair market value that is determined by local assessors to be the total taxable value of land and additions on the property. | Land | Improvement |
|---|---|---|---|---|
| 2024 | $1,324 | $32,020 | $3,720 | $28,300 |
| 2023 | $1,324 | $25,235 | $2,863 | $22,372 |
| 2022 | $1,232 | $25,235 | $2,863 | $22,372 |
| 2021 | $1,234 | $25,235 | $2,863 | $22,372 |
| 2020 | $1,262 | $24,987 | $2,786 | $22,201 |
| 2019 | $1,277 | $24,987 | $2,786 | $22,201 |
| 2018 | $1,214 | $24,987 | $2,786 | $22,201 |
| 2017 | $1,189 | $22,611 | $2,601 | $20,010 |
| 2016 | $1,142 | $22,611 | $2,601 | $20,010 |
| 2015 | $1,205 | $22,611 | $2,601 | $20,010 |
| 2014 | $7,372 | $22,320 | $3,469 | $18,851 |
Source: Public Records
Map
Nearby Homes
Your Personal Tour Guide
Ask me questions while you tour the home.