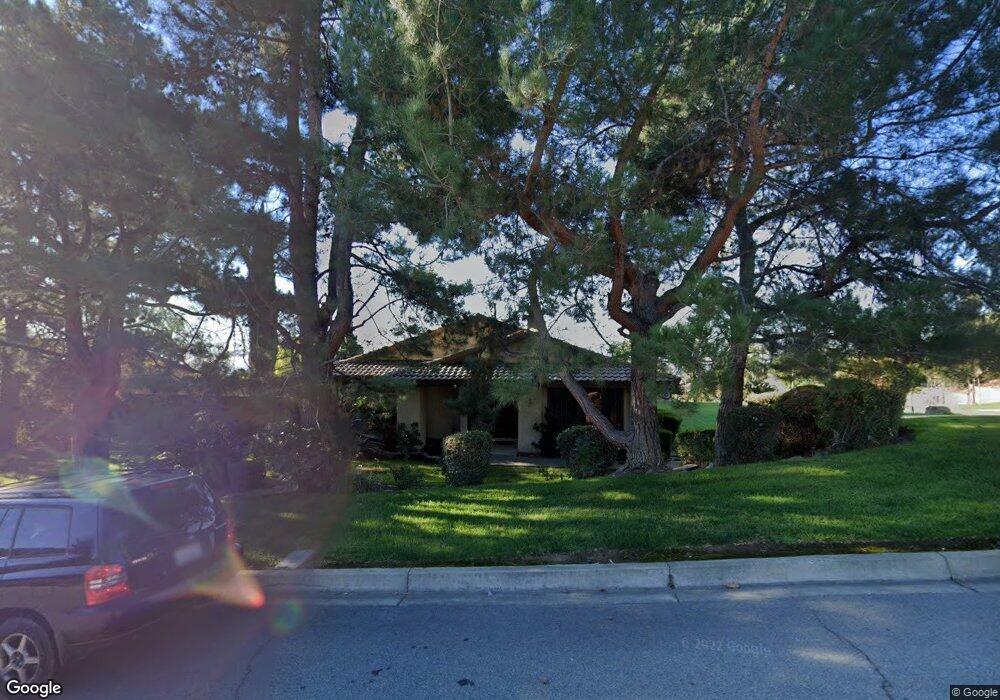
9155 Carrari Ct Rancho Cucamonga, CA 91737
Estimated Value: $916,166 - $1,358,000
3
Beds
2
Baths
1,848
Sq Ft
$625/Sq Ft
Est. Value
About This Home
This home is located at 9155 Carrari Ct, Rancho Cucamonga, CA 91737 and is currently estimated at $1,155,792, approximately $625 per square foot. 9155 Carrari Ct is a home located in San Bernardino County with nearby schools including Floyd M. Stork Elementary, Alta Loma Junior High, and Los Osos High.
Ownership History
Date
Name
Owned For
Owner Type
Purchase Details
Closed on
Jul 16, 2018
Sold by
Griffin Allen G
Bought by
Griffin Allen G and Griffin Wanda L
Current Estimated Value
Purchase Details
Closed on
Jul 1, 1998
Sold by
Anderson Jack J and Anderson Maria I
Bought by
Griffin Allen G and Griffin Wanda L
Home Financials for this Owner
Home Financials are based on the most recent Mortgage that was taken out on this home.
Original Mortgage
$202,000
Outstanding Balance
$51,009
Interest Rate
9.65%
Estimated Equity
$1,104,783
Create a Home Valuation Report for This Property
The Home Valuation Report is an in-depth analysis detailing your home's value as well as a comparison with similar homes in the area
Home Values in the Area
Average Home Value in this Area
Purchase History
| Date | Buyer | Sale Price | Title Company |
|---|---|---|---|
| Griffin Allen G | -- | None Available | |
| Griffin Allen G | $252,500 | Chicago Title Co |
Source: Public Records
Mortgage History
| Date | Status | Borrower | Loan Amount |
|---|---|---|---|
| Open | Griffin Allen G | $202,000 |
Source: Public Records
Tax History Compared to Growth
Tax History
| Year | Tax Paid | Tax Assessment Tax Assessment Total Assessment is a certain percentage of the fair market value that is determined by local assessors to be the total taxable value of land and additions on the property. | Land | Improvement |
|---|---|---|---|---|
| 2025 | $4,620 | $425,826 | $133,256 | $292,570 |
| 2024 | $4,620 | $417,476 | $130,643 | $286,833 |
| 2023 | $4,516 | $409,290 | $128,081 | $281,209 |
| 2022 | $4,505 | $401,265 | $125,570 | $275,695 |
| 2021 | $4,504 | $393,397 | $123,108 | $270,289 |
| 2020 | $4,318 | $389,364 | $121,846 | $267,518 |
| 2019 | $4,368 | $381,730 | $119,457 | $262,273 |
| 2018 | $4,270 | $374,245 | $117,115 | $257,130 |
| 2017 | $4,076 | $366,907 | $114,819 | $252,088 |
| 2016 | $3,965 | $359,713 | $112,568 | $247,145 |
| 2015 | $3,940 | $354,310 | $110,877 | $243,433 |
| 2014 | $3,829 | $347,369 | $108,705 | $238,664 |
Source: Public Records
Map
Nearby Homes
- 5338 Falling Tree Ln
- 9179 Hidden Farm Rd
- 9239 Camellia Ct
- 9227 Camellia Ct
- 9230 Camellia Ct
- 9220 Camellia Ct
- 9210 Camellia Ct
- 9209 Camellia Ct
- 9201 Camellia Ct
- 8967 Citation Ct
- 9066 Laramie Dr
- 8915 Appaloosa Ct
- 8798 Justify Dr
- 5291 Carnelian St
- 9609 Norbrook Dr
- 5063 Klusman Ave
- 8911 Mustang Rd
- 9655 Norbrook Dr
- 5327 Topaz St
- 8326 La Senda Rd
- 9167 Carrari Ct
- 9117 Carrari Ct
- 9150 Whirlaway Ct
- 9179 Carrari Ct
- 9166 Whirlaway Ct
- 5304 Falling Tree Ln
- 9111 Carrari Ct
- 9154 Carrari Ct
- 9140 Carrari Ct
- 9172 Whirlaway Ct
- 9197 Carrari Ct
- 9126 Carrari Ct
- 9178 Carrari Ct
- 5320 Falling Tree Ln
- 9176 Whirlaway Ct
- 9192 Carrari Ct
- 9110 Carrari Ct
- 9215 Carrari Ct
- 9204 Carrari Ct
- 9086 Appaloosa Ct