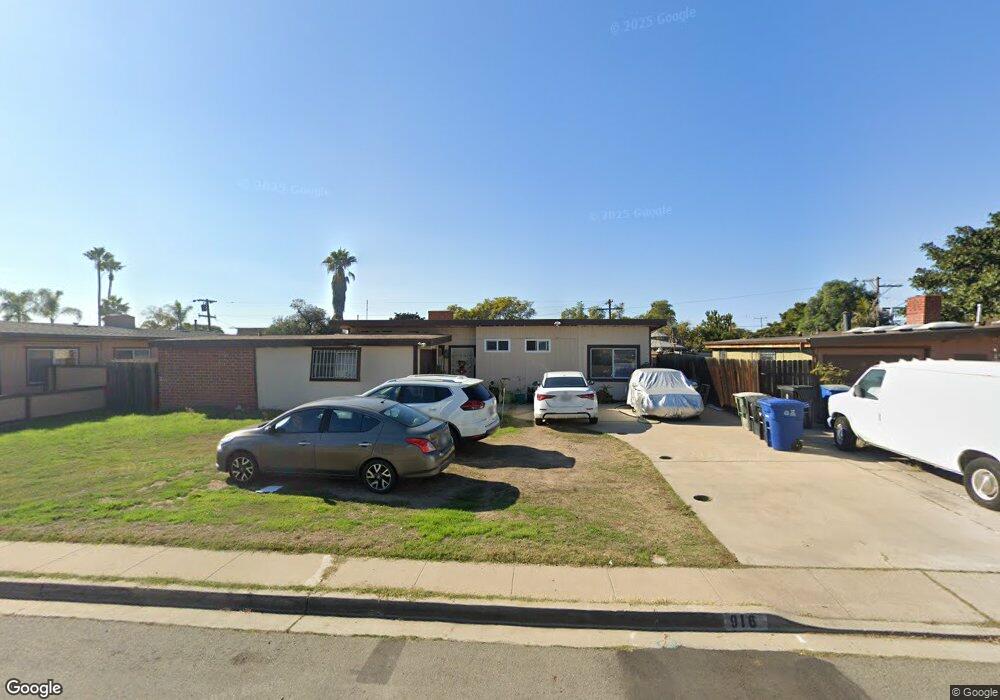
916 Agua Tibia Ave Chula Vista, CA 91911
Castle Park NeighborhoodEstimated Value: $685,000 - $746,000
About This Home
This home is located at 916 Agua Tibia Ave, Chula Vista, CA 91911 and is currently estimated at $721,711, approximately $687 per square foot. 916 Agua Tibia Ave is a home located in San Diego County with nearby schools including Cook Elementary School, Hilltop Middle School, and Hilltop Senior High School.
Ownership History
We collect this data history from publicly available records. To have your information removed, we recommend requesting removal directly through your county’s website.
Purchase Details
Home Financials for this Owner
Home Financials are based on the most recent Mortgage that was taken out on this home.Purchase Details
Purchase Details
Home Financials for this Owner
Home Financials are based on the most recent Mortgage that was taken out on this home.Purchase Details
Home Financials for this Owner
Home Financials are based on the most recent Mortgage that was taken out on this home.Purchase Details
Home Values in the Area
Average Home Value in this Area
Purchase History
We collect this data history from publicly available records. To have your information removed, we recommend requesting removal directly through your county’s website.
| Date | Buyer | Sale Price | Title Company |
|---|---|---|---|
| -- | Accommodation | ||
| -- | Fidelity National Title Co | ||
| -- | None Available | ||
| $220,000 | California Counties Title Co | ||
| $450,000 | North American Title Co | ||
| -- | -- |
Mortgage History
We collect this data history from publicly available records. To have your information removed, we recommend requesting removal directly through your county’s website.
| Date | Status | Borrower | Loan Amount |
|---|---|---|---|
| Open | $168,000 | ||
| Closed | $176,000 | ||
| Previous Owner | $67,500 | ||
| Previous Owner | $360,000 |
Tax History
We collect this data history from publicly available records. To have your information removed, we recommend requesting removal directly through your county’s website.
| Year | Tax Paid | Tax Assessment Tax Assessment Total Assessment is a certain percentage of the fair market value that is determined by local assessors to be the total taxable value of land and additions on the property. | Land | Improvement |
|---|---|---|---|---|
| 2025 | $3,288 | $283,967 | $180,707 | $103,260 |
| 2024 | $3,288 | $278,400 | $177,164 | $101,236 |
| 2023 | $3,243 | $272,942 | $173,691 | $99,251 |
| 2022 | $3,150 | $267,591 | $170,286 | $97,305 |
| 2021 | $3,078 | $262,346 | $166,948 | $95,398 |
| 2020 | $3,005 | $259,657 | $165,237 | $94,420 |
| 2019 | $2,927 | $254,567 | $161,998 | $92,569 |
| 2018 | $2,882 | $249,576 | $158,822 | $90,754 |
| 2017 | $2,822 | $244,683 | $155,708 | $88,975 |
| 2016 | $2,756 | $239,886 | $152,655 | $87,231 |
| 2015 | $2,717 | $236,283 | $150,362 | $85,921 |
| 2014 | $2,673 | $231,655 | $147,417 | $84,238 |
Map
- 912 Agua Tibia Ave
- 920 Agua Tibia Ave
- 917 Hilltop Dr
- 926 Agua Tibia Ave
- 921 Hilltop Dr
- 911 Hilltop Dr
- 16 E L St
- 10 E L St
- 927 Hilltop Dr
- 917 Agua Tibia Ave
- 932 Agua Tibia Ave
- 911 Agua Tibia Ave
- 4 E L St
- 921 Agua Tibia Ave
- 28 E L St
- 931 Hilltop Dr
- 34 E L St
- 931 Agua Tibia Ave
- 912 Evans Ave
- 8 L St Unit 10
Ask me questions while you tour the home.