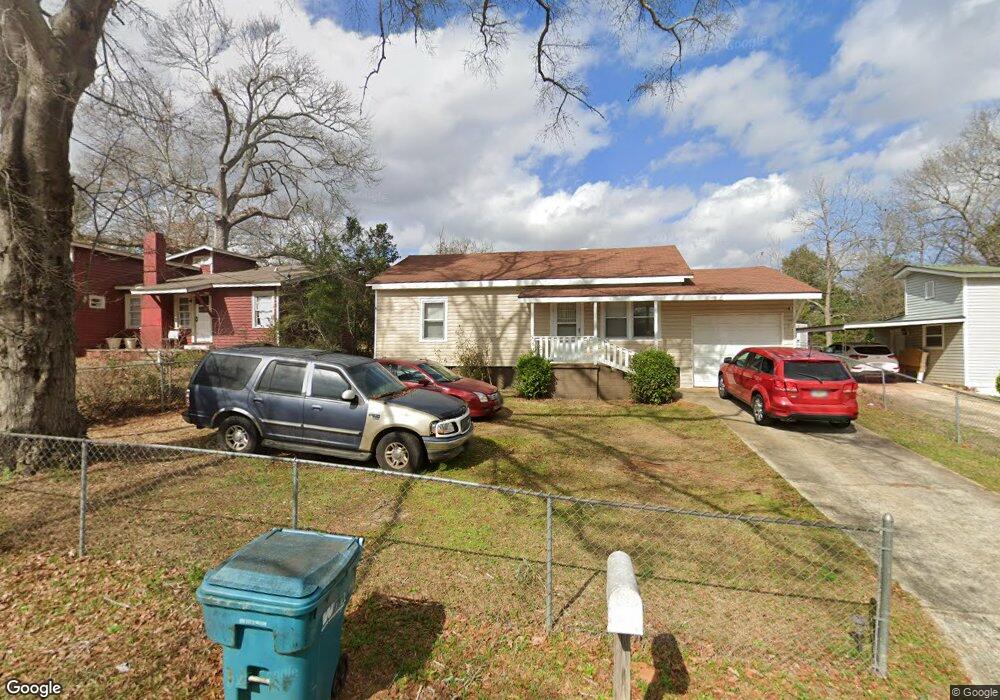
916 Angus Dr Americus, GA 31709
Estimated Value: $81,000 - $103,000
2
Beds
1
Bath
884
Sq Ft
$103/Sq Ft
Est. Value
About This Home
This home is located at 916 Angus Dr, Americus, GA 31709 and is currently estimated at $91,436, approximately $103 per square foot. 916 Angus Dr is a home located in Sumter County with nearby schools including Sumter County Primary School, Sumter County Elementary School, and Sumter County Middle School.
Ownership History
Date
Name
Owned For
Owner Type
Purchase Details
Closed on
Oct 21, 2022
Sold by
Tyson Slexiaer U
Bought by
Sykes John
Current Estimated Value
Home Financials for this Owner
Home Financials are based on the most recent Mortgage that was taken out on this home.
Original Mortgage
$72,653
Outstanding Balance
$70,219
Interest Rate
6.7%
Mortgage Type
New Conventional
Estimated Equity
$21,217
Purchase Details
Closed on
Mar 13, 2022
Sold by
Tyson James L
Bought by
Tyson Slexiaer U
Purchase Details
Closed on
Feb 13, 2017
Sold by
Courson Darrell Edgar
Bought by
Tyson Slexiaer U and Tyson James L
Purchase Details
Closed on
Aug 20, 1996
Sold by
Goolsby Agnes M
Bought by
Courson Darrell
Purchase Details
Closed on
Apr 12, 1983
Bought by
Goolsby Agnes M
Purchase Details
Closed on
Mar 29, 1983
Bought by
Bank Of Commerce
Purchase Details
Closed on
Dec 23, 1982
Bought by
First Federal Saving
Create a Home Valuation Report for This Property
The Home Valuation Report is an in-depth analysis detailing your home's value as well as a comparison with similar homes in the area
Home Values in the Area
Average Home Value in this Area
Purchase History
| Date | Buyer | Sale Price | Title Company |
|---|---|---|---|
| Sykes John | $74,900 | -- | |
| Tyson Slexiaer U | -- | -- | |
| Tyson Slexiaer U | $23,000 | -- | |
| Courson Darrell | -- | -- | |
| Goolsby Agnes M | $20,000 | -- | |
| Bank Of Commerce | $19,900 | -- | |
| First Federal Saving | $24,500 | -- |
Source: Public Records
Mortgage History
| Date | Status | Borrower | Loan Amount |
|---|---|---|---|
| Open | Sykes John | $72,653 |
Source: Public Records
Tax History Compared to Growth
Tax History
| Year | Tax Paid | Tax Assessment Tax Assessment Total Assessment is a certain percentage of the fair market value that is determined by local assessors to be the total taxable value of land and additions on the property. | Land | Improvement |
|---|---|---|---|---|
| 2024 | $599 | $13,280 | $2,080 | $11,200 |
| 2023 | $586 | $13,280 | $2,080 | $11,200 |
| 2022 | $401 | $13,280 | $2,080 | $11,200 |
| 2021 | $587 | $13,280 | $2,080 | $11,200 |
| 2020 | $710 | $13,280 | $2,080 | $11,200 |
| 2019 | $635 | $13,280 | $2,080 | $11,200 |
| 2018 | $289 | $13,280 | $2,080 | $11,200 |
| 2017 | $355 | $13,280 | $2,080 | $11,200 |
| 2016 | $524 | $13,280 | $2,080 | $11,200 |
| 2015 | $392 | $14,800 | $2,080 | $12,720 |
| 2014 | $393 | $14,800 | $2,080 | $12,720 |
| 2013 | -- | $14,800 | $2,080 | $12,720 |
Source: Public Records
Map
Nearby Homes
- 621 E Church St
- 518 E Furlow St
- 211 Horne St
- TBD E Lamar St
- 1720 E Lamar St
- 105 Springfield Ave
- 501 S Lee St
- 333 Academy St
- 525 Ashby St
- Lots 5 6 13 14 Hwy 49n
- 302 W College St
- 604 A-C Ga Hwy 49s
- 126 Bell St
- 513 Winn St
- 624 Harrold Ave
- 229 Bell St
- 122 Academy St
- 704 Harrold Ave
- 130 W Dodson St
- 1105 Elm Ave