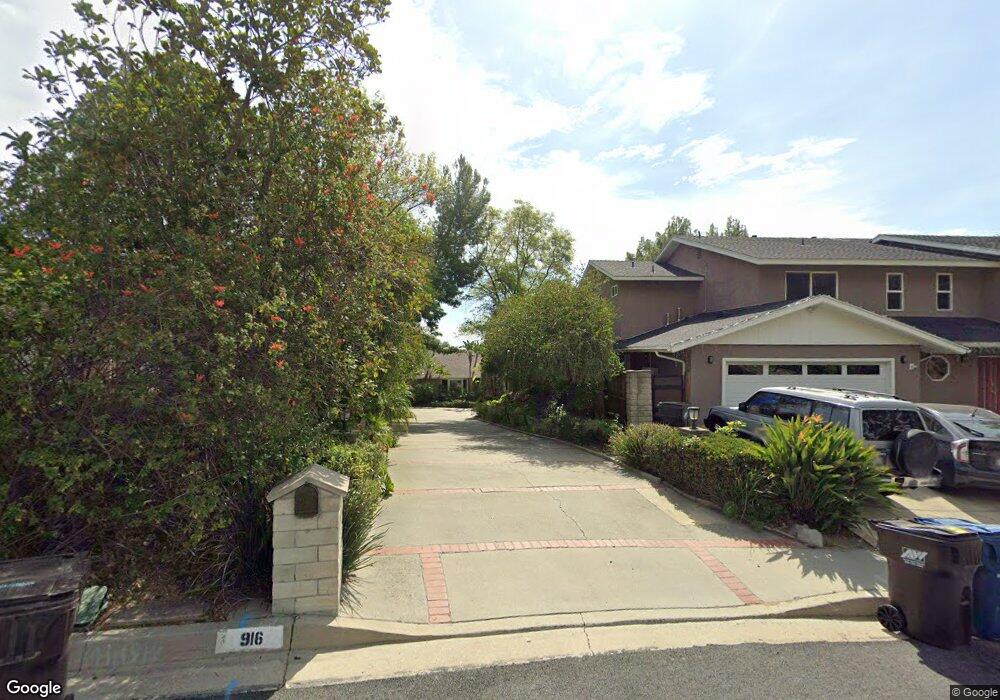
916 Big Briar Way La Canada Flintridge, CA 91011
Estimated Value: $2,341,535 - $2,837,000
3
Beds
3
Baths
2,656
Sq Ft
$966/Sq Ft
Est. Value
About This Home
This home is located at 916 Big Briar Way, La Canada Flintridge, CA 91011 and is currently estimated at $2,566,384, approximately $966 per square foot. 916 Big Briar Way is a home located in Los Angeles County with nearby schools including Palm Crest Elementary School, La Canada High School, and La Canada Preparatory School.
Ownership History
Date
Name
Owned For
Owner Type
Purchase Details
Closed on
Jun 17, 2011
Sold by
Rajagopalan Sampath and Rajagopalan Nandini
Bought by
Rajagopalan Sampath and Rajagopalan Nandini
Current Estimated Value
Home Financials for this Owner
Home Financials are based on the most recent Mortgage that was taken out on this home.
Original Mortgage
$384,000
Outstanding Balance
$26,031
Interest Rate
4.55%
Mortgage Type
New Conventional
Estimated Equity
$2,540,353
Purchase Details
Closed on
Dec 14, 2010
Sold by
Rajagopalan Sampath and Rajagopalan Nandini
Bought by
Rajagopalan Sampath and Rajagopalan Nandini
Purchase Details
Closed on
Apr 21, 2000
Sold by
Taranto Peter A and Taranto Karen C
Bought by
Rajagopalan Sampath and Rajagopalan Nandini
Home Financials for this Owner
Home Financials are based on the most recent Mortgage that was taken out on this home.
Original Mortgage
$628,000
Interest Rate
8%
Create a Home Valuation Report for This Property
The Home Valuation Report is an in-depth analysis detailing your home's value as well as a comparison with similar homes in the area
Home Values in the Area
Average Home Value in this Area
Purchase History
| Date | Buyer | Sale Price | Title Company |
|---|---|---|---|
| Rajagopalan Sampath | -- | First American Title Company | |
| Rajagopalan Sampath | -- | First American Title Company | |
| Rajagopalan Sampath | -- | None Available | |
| Rajagopalan Sampath | $785,000 | Southland Title Corporation |
Source: Public Records
Mortgage History
| Date | Status | Borrower | Loan Amount |
|---|---|---|---|
| Open | Rajagopalan Sampath | $384,000 | |
| Previous Owner | Rajagopalan Sampath | $628,000 |
Source: Public Records
Tax History Compared to Growth
Tax History
| Year | Tax Paid | Tax Assessment Tax Assessment Total Assessment is a certain percentage of the fair market value that is determined by local assessors to be the total taxable value of land and additions on the property. | Land | Improvement |
|---|---|---|---|---|
| 2025 | $14,112 | $1,219,713 | $965,218 | $254,495 |
| 2024 | $14,112 | $1,195,798 | $946,293 | $249,505 |
| 2023 | $13,775 | $1,172,352 | $927,739 | $244,613 |
| 2022 | $13,230 | $1,149,366 | $909,549 | $239,817 |
| 2021 | $13,120 | $1,126,830 | $891,715 | $235,115 |
| 2019 | $13,580 | $1,093,410 | $865,267 | $228,143 |
| 2018 | $13,242 | $1,071,971 | $848,301 | $223,670 |
| 2016 | $12,786 | $1,030,347 | $815,361 | $214,986 |
| 2015 | $12,623 | $1,014,871 | $803,114 | $211,757 |
| 2014 | $12,466 | $994,992 | $787,383 | $207,609 |
Source: Public Records
Map
Nearby Homes
- 5350 Harter Ln
- 943 Bay Tree Rd
- 935 Bay Tree Rd
- 5805 Briartree Dr
- 5148 Angeles Crest Hwy
- 5130 Hayman Ave
- 848 Greenridge Dr
- 5123 Caroli Ln
- 4720 Olive Ct
- 5117 Stoneglen Rd
- 4901 Angeles Crest Cir
- 4825 Angeles Crest Hwy
- 1737 Fairmount Ave
- 5260 Palm Dr
- 5245 Bubbling Well Ln
- 5419 Godbey Dr
- 5220 Palm Dr
- 0 La Sierra & Palm Dr
- 909 Coral Way
- 4547 Lasheart Dr
- 920 Big Briar Way
- 912 Big Briar Way
- 5385 Vista Lejana Ln
- 908 Big Briar Way
- 928 Big Briar Way
- 906 Big Briar Way
- 5391 Vista Lejana Ln
- 900 Big Briar Way
- 911 Big Briar Way
- 5390 Vista Lejana Ln
- 936 Big Briar Way
- 5388 Vista Lejana Ln
- 842 E Big Briar Way
- 5361 Vista Lejana Ln
- 935 Big Briar Way
- 944 Big Briar Way
- 1001 Ridgecliff Ln
- 5337 Mountain Meadow Ln
- 5399 Harter Ln
- 840 E Big Briar Way