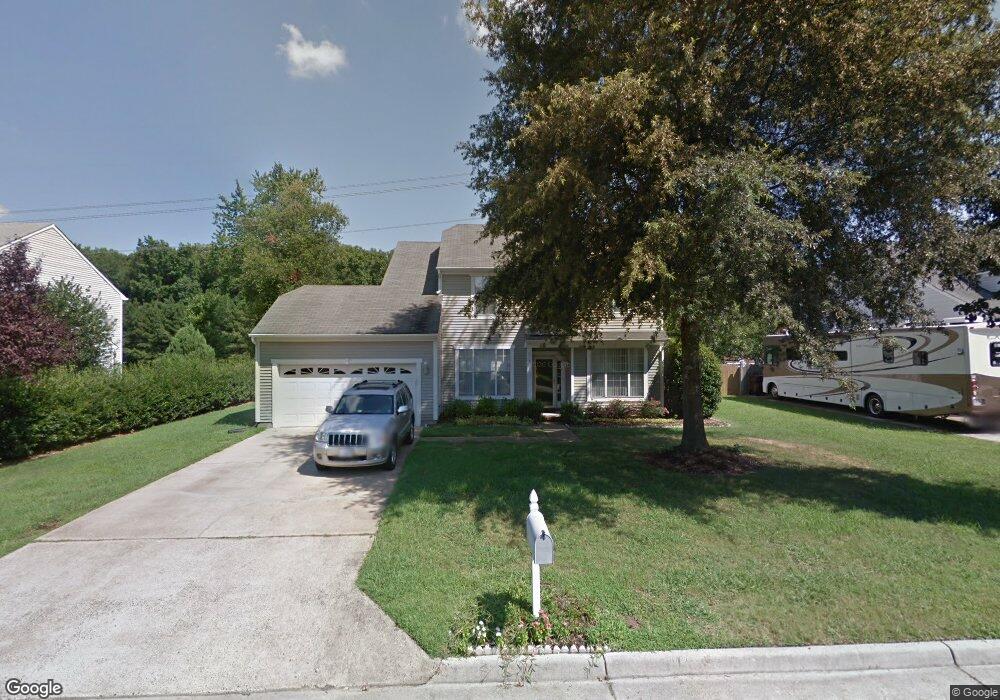
916 Cantor St Chesapeake, VA 23322
Great Bridge NeighborhoodEstimated Value: $513,000 - $530,000
4
Beds
3
Baths
2,334
Sq Ft
$224/Sq Ft
Est. Value
About This Home
This home is located at 916 Cantor St, Chesapeake, VA 23322 and is currently estimated at $522,576, approximately $223 per square foot. 916 Cantor St is a home located in Chesapeake City with nearby schools including Southeastern Elementary School, Great Bridge Middle School, and Great Bridge High.
Ownership History
Date
Name
Owned For
Owner Type
Purchase Details
Closed on
Aug 7, 2015
Sold by
Midgett O Chaytor and Midgett Alecia L
Bought by
Gordon Derek S
Current Estimated Value
Home Financials for this Owner
Home Financials are based on the most recent Mortgage that was taken out on this home.
Original Mortgage
$279,632
Outstanding Balance
$219,929
Interest Rate
4.03%
Mortgage Type
VA
Estimated Equity
$302,647
Purchase Details
Closed on
Jul 29, 2004
Sold by
Hofilena Delmer
Bought by
Midgett O Chaytor
Home Financials for this Owner
Home Financials are based on the most recent Mortgage that was taken out on this home.
Original Mortgage
$243,450
Interest Rate
6.08%
Mortgage Type
New Conventional
Purchase Details
Closed on
Sep 19, 2001
Sold by
Morgante Samuel A
Bought by
Hofilena Delmer F
Home Financials for this Owner
Home Financials are based on the most recent Mortgage that was taken out on this home.
Original Mortgage
$180,000
Interest Rate
6.77%
Create a Home Valuation Report for This Property
The Home Valuation Report is an in-depth analysis detailing your home's value as well as a comparison with similar homes in the area
Home Values in the Area
Average Home Value in this Area
Purchase History
| Date | Buyer | Sale Price | Title Company |
|---|---|---|---|
| Gordon Derek S | $290,000 | -- | |
| Midgett O Chaytor | $273,500 | -- | |
| Hofilena Delmer F | $180,000 | -- |
Source: Public Records
Mortgage History
| Date | Status | Borrower | Loan Amount |
|---|---|---|---|
| Open | Gordon Derek S | $279,632 | |
| Previous Owner | Midgett O Chaytor | $243,450 | |
| Previous Owner | Hofilena Delmer F | $180,000 |
Source: Public Records
Tax History Compared to Growth
Tax History
| Year | Tax Paid | Tax Assessment Tax Assessment Total Assessment is a certain percentage of the fair market value that is determined by local assessors to be the total taxable value of land and additions on the property. | Land | Improvement |
|---|---|---|---|---|
| 2025 | $4,607 | $471,000 | $190,000 | $281,000 |
| 2024 | $4,607 | $456,100 | $180,000 | $276,100 |
| 2023 | $4,012 | $430,100 | $170,000 | $260,100 |
| 2022 | $3,974 | $393,500 | $150,000 | $243,500 |
| 2021 | $3,754 | $357,500 | $135,000 | $222,500 |
| 2020 | $3,512 | $334,500 | $130,000 | $204,500 |
| 2019 | $3,501 | $333,400 | $125,000 | $208,400 |
| 2018 | $3,448 | $328,400 | $120,000 | $208,400 |
| 2017 | $3,350 | $319,000 | $120,000 | $199,000 |
| 2016 | $3,237 | $308,300 | $117,000 | $191,300 |
| 2015 | $3,332 | $317,300 | $117,000 | $200,300 |
| 2014 | $3,080 | $293,300 | $102,000 | $191,300 |
Source: Public Records
Map
Nearby Homes
- 917 Barrington Ct
- 917 Brice Ct
- 904 Brice Ct
- 916 Brice Ct
- 821 Birch Forest Ct
- 809 Obsidian Ct
- 915 Forest Lakes Dr
- 701 Amberline Ct
- 1005 Ekaterina Ct
- 823 Keeling Dr
- 810 Keeling Dr
- 1028 Loutro Ct
- The Platinum II Plan at Stoney Creek
- The Capstone Plan at Stoney Creek
- The Cornerstone Plan at Stoney Creek
- The Platinum II Plan at Stoney Creek - Estate Sites
- The Meridian II Plan at Stoney Creek - Estate Sites
- The Capstone Plan at Stoney Creek - Estate Sites
- The Cornerstone Plan at Stoney Creek - Estate Sites
- The Legacy Plan at Stoney Creek - Estate Sites