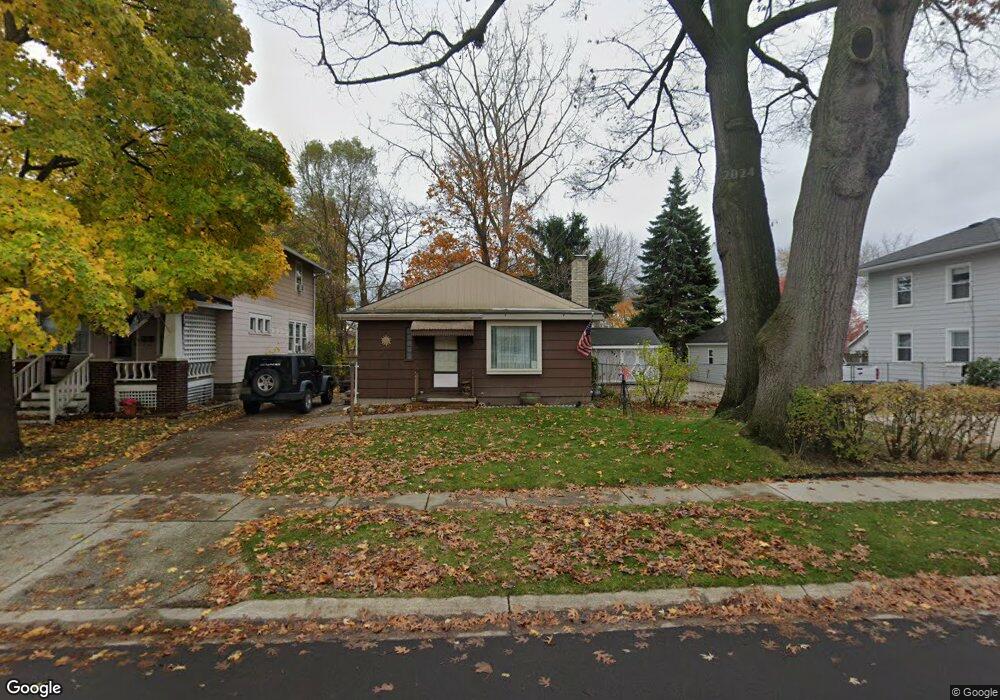
916 Jenkinson St Port Huron, MI 48060
Estimated Value: $125,000 - $156,000
2
Beds
2
Baths
872
Sq Ft
$159/Sq Ft
Est. Value
About This Home
This home is located at 916 Jenkinson St, Port Huron, MI 48060 and is currently estimated at $138,680, approximately $159 per square foot. 916 Jenkinson St is a home located in St. Clair County with nearby schools including Woodrow Wilson Elementary School, Central Middle School, and Port Huron High School.
Ownership History
Date
Name
Owned For
Owner Type
Purchase Details
Closed on
Apr 1, 2025
Sold by
Mearim Properties Llc
Bought by
Musselman Jennifer Lynn
Current Estimated Value
Purchase Details
Closed on
Mar 28, 2025
Sold by
Teal Pedro
Bought by
Mearim Properties Llc
Purchase Details
Closed on
Nov 2, 2018
Sold by
Mearim Properties Llc
Bought by
Mearim Properties Llc
Purchase Details
Closed on
Mar 28, 2017
Sold by
Mussel Man Jennifer and Mussel Man Roy
Bought by
Mearim Properties Llc
Purchase Details
Closed on
Jun 30, 2006
Sold by
Bowman Linda A
Bought by
Mussleman Roy Mark and Mussleman Jennifer
Home Financials for this Owner
Home Financials are based on the most recent Mortgage that was taken out on this home.
Original Mortgage
$73,600
Interest Rate
10.15%
Mortgage Type
Adjustable Rate Mortgage/ARM
Create a Home Valuation Report for This Property
The Home Valuation Report is an in-depth analysis detailing your home's value as well as a comparison with similar homes in the area
Home Values in the Area
Average Home Value in this Area
Purchase History
| Date | Buyer | Sale Price | Title Company |
|---|---|---|---|
| Musselman Jennifer Lynn | -- | None Listed On Document | |
| Mearim Properties Llc | -- | None Listed On Document | |
| Mearim Properties Llc | -- | None Available | |
| Mearim Properties Llc | -- | -- | |
| Musselman Jennifer | -- | -- | |
| Mussleman Roy Mark | $92,000 | None Available |
Source: Public Records
Mortgage History
| Date | Status | Borrower | Loan Amount |
|---|---|---|---|
| Previous Owner | Mussleman Roy Mark | $73,600 |
Source: Public Records
Tax History Compared to Growth
Tax History
| Year | Tax Paid | Tax Assessment Tax Assessment Total Assessment is a certain percentage of the fair market value that is determined by local assessors to be the total taxable value of land and additions on the property. | Land | Improvement |
|---|---|---|---|---|
| 2025 | $2,427 | $60,200 | $0 | $0 |
| 2024 | $1,906 | $57,200 | $0 | $0 |
| 2023 | $1,805 | $51,000 | $0 | $0 |
| 2022 | $1,803 | $46,100 | $0 | $0 |
| 2021 | $1,223 | $40,100 | $0 | $0 |
| 2020 | $1,237 | $35,300 | $35,300 | $0 |
| 2019 | $1,215 | $24,800 | $0 | $0 |
| 2018 | $1,659 | $24,800 | $0 | $0 |
| 2017 | $632 | $23,200 | $0 | $0 |
| 2016 | $529 | $23,200 | $0 | $0 |
| 2015 | $864 | $23,200 | $23,200 | $0 |
| 2014 | $864 | $24,100 | $24,100 | $0 |
| 2013 | -- | $26,900 | $0 | $0 |
Source: Public Records
Map
Nearby Homes
- 730 Jenkinson St
- 823 Beard St
- 738 Bancroft St
- 831 Bancroft St
- 731 Bancroft St
- 2109 Military St
- 2444 Military St
- 1112 Minnie St
- 1831 11th St
- 1127 Minnie St
- 1623 8th St
- 1712 7th St
- 926 Griswold St
- 1309 Division St
- 620 Griswold St
- 1132 Griswold St
- 1322 Division St
- 000 10th St
- 1325 Division St
- 1403 Catherine McAuley Dr
- 906 Jenkinson St
- 915 Johnstone St
- 925 Johnstone St
- 924 Jenkinson St
- 904 Jenkinson St
- 900 Jenkinson St
- 900 Jenkinson St
- 928 Jenkinson St
- 909 Johnstone St
- 927 Johnstone St
- 905 Johnstone St
- 915 Jenkinson St
- 907 Jenkinson St
- 903 Jenkinson St
- 921 Jenkinson St
- 2222 10th St
- 908 Johnstone St
- 912 Johnstone St
- 2204 10th St
- 930 Johnstone St