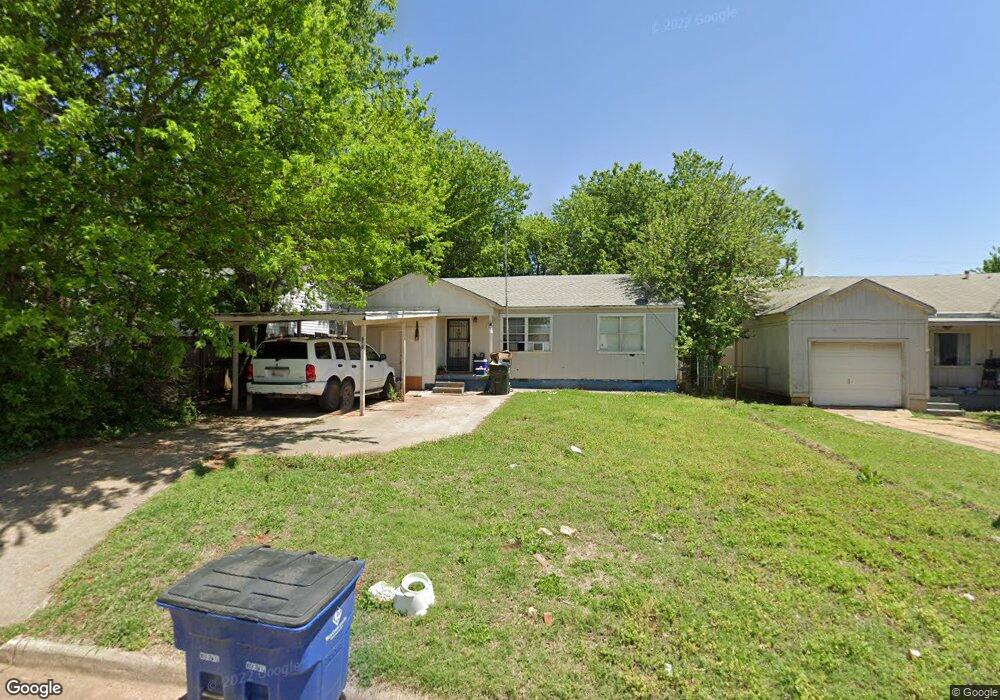
916 N C St Duncan, OK 73533
Estimated Value: $46,000 - $53,057
2
Beds
1
Bath
1,069
Sq Ft
$47/Sq Ft
Est. Value
About This Home
This home is located at 916 N C St, Duncan, OK 73533 and is currently estimated at $50,264, approximately $47 per square foot. 916 N C St is a home located in Stephens County with nearby schools including Woodrow Wilson Elementary School, Duncan Middle School, and Duncan High School.
Ownership History
Date
Name
Owned For
Owner Type
Purchase Details
Closed on
Aug 1, 2022
Sold by
Diyz Henondee Agopita
Bought by
Diaz Juan M
Current Estimated Value
Purchase Details
Closed on
Feb 26, 2016
Sold by
Gonzalez Amparo Diaz De
Bought by
Hernandez Agapito Diaz
Purchase Details
Closed on
Oct 16, 2015
Sold by
Diaz-Hernandez Felipe
Bought by
Diaz Juan M
Purchase Details
Closed on
Jul 24, 2009
Sold by
Walters Harold G and Walters Misty S
Bought by
Hernandez Felipe Diaz
Home Financials for this Owner
Home Financials are based on the most recent Mortgage that was taken out on this home.
Original Mortgage
$20,379
Interest Rate
5.71%
Mortgage Type
Purchase Money Mortgage
Purchase Details
Closed on
May 1, 2007
Sold by
Buckley Hazel and Pearce Terrie A
Bought by
Walters Harold G and Walters Misty S
Purchase Details
Closed on
Nov 20, 1996
Sold by
Morris Gary Dwain
Create a Home Valuation Report for This Property
The Home Valuation Report is an in-depth analysis detailing your home's value as well as a comparison with similar homes in the area
Home Values in the Area
Average Home Value in this Area
Purchase History
| Date | Buyer | Sale Price | Title Company |
|---|---|---|---|
| Diaz Juan M | -- | None Listed On Document | |
| Hernandez Agapito Diaz | $25,000 | None Available | |
| Diaz Juan M | $25,000 | None Available | |
| Hernandez Felipe Diaz | $18,000 | None Available | |
| Walters Harold G | $20,000 | Stewart Abstract & Title | |
| -- | $18,500 | -- |
Source: Public Records
Mortgage History
| Date | Status | Borrower | Loan Amount |
|---|---|---|---|
| Previous Owner | Hernandez Felipe Diaz | $20,379 |
Source: Public Records
Tax History Compared to Growth
Tax History
| Year | Tax Paid | Tax Assessment Tax Assessment Total Assessment is a certain percentage of the fair market value that is determined by local assessors to be the total taxable value of land and additions on the property. | Land | Improvement |
|---|---|---|---|---|
| 2025 | $220 | $2,611 | $356 | $2,255 |
| 2024 | $228 | $2,675 | $356 | $2,319 |
| 2023 | $228 | $2,596 | $356 | $2,240 |
| 2022 | $216 | $2,787 | $356 | $2,431 |
| 2021 | $216 | $2,545 | $356 | $2,189 |
| 2020 | $199 | $2,309 | $356 | $1,953 |
| 2019 | $190 | $2,199 | $356 | $1,843 |
| 2018 | $202 | $2,271 | $356 | $1,915 |
| 2017 | $252 | $2,933 | $356 | $2,577 |
| 2016 | $234 | $2,757 | $356 | $2,401 |
| 2015 | $203 | $2,440 | $356 | $2,084 |
| 2014 | $203 | $2,440 | $356 | $2,084 |
Source: Public Records
Map
Nearby Homes