Estimated Value: $266,804 - $295,000
3
Beds
2
Baths
1,866
Sq Ft
$151/Sq Ft
Est. Value
About This Home
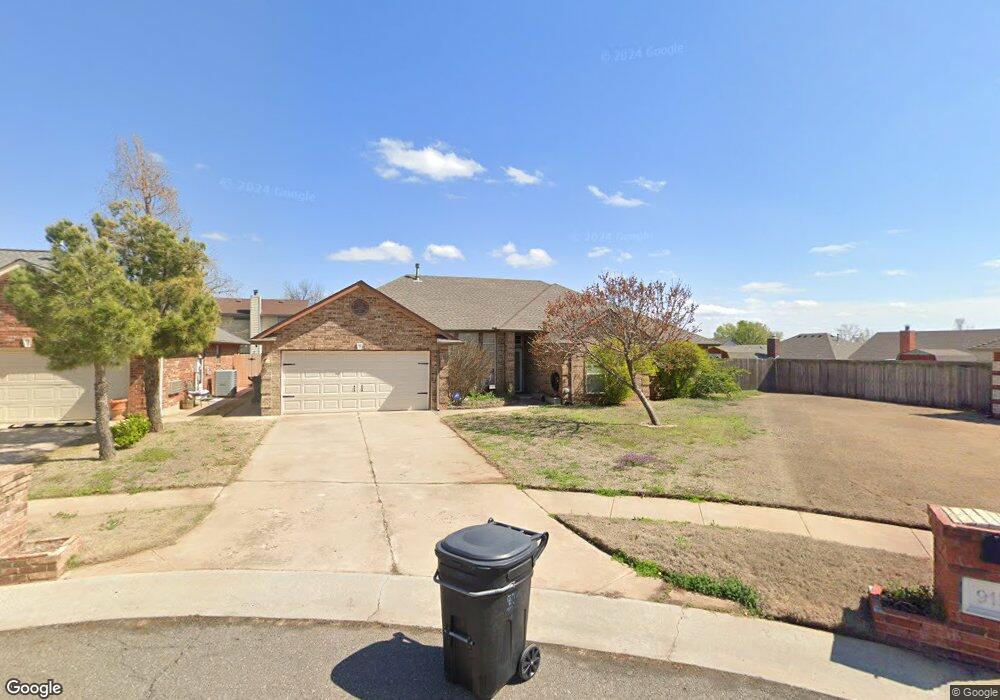
This home is located at 916 NE 25th Ct, Moore, OK 73160 and is currently estimated at $281,701, approximately $150 per square foot. 916 NE 25th Ct is a home located in Cleveland County with nearby schools including Winding Creek Elementary School, Central Junior High School, and Moore High School.
Ownership History
Date
Name
Owned For
Owner Type
Purchase Details
Closed on
Jul 21, 2022
Sold by
Dunk Joseph Eric
Bought by
Dunk Julia
Current Estimated Value
Purchase Details
Closed on
Apr 8, 2016
Sold by
Dunk Joseph and Dunk Julia
Bought by
Dunk Joseph and Dunk Julia
Home Financials for this Owner
Home Financials are based on the most recent Mortgage that was taken out on this home.
Original Mortgage
$145,250
Interest Rate
3.64%
Mortgage Type
VA
Purchase Details
Closed on
Apr 12, 2010
Sold by
Wright Kevin and Wright Chelsey N
Bought by
Dunk Joseph
Home Financials for this Owner
Home Financials are based on the most recent Mortgage that was taken out on this home.
Original Mortgage
$163,440
Interest Rate
4.96%
Mortgage Type
VA
Purchase Details
Closed on
Apr 11, 2005
Sold by
Tom Abel Homes Inc
Bought by
Wright Kevin
Home Financials for this Owner
Home Financials are based on the most recent Mortgage that was taken out on this home.
Original Mortgage
$119,920
Interest Rate
6.87%
Mortgage Type
Adjustable Rate Mortgage/ARM
Purchase Details
Closed on
Jan 6, 2004
Sold by
Methvin, Paul Homes Inc
Bought by
Abel, Tom Homes Inc
Create a Home Valuation Report for This Property
The Home Valuation Report is an in-depth analysis detailing your home's value as well as a comparison with similar homes in the area
Home Values in the Area
Average Home Value in this Area
Purchase History
| Date | Buyer | Sale Price | Title Company |
|---|---|---|---|
| Dunk Julia | -- | -- | |
| Dunk Joseph | -- | None Available | |
| Dunk Joseph | $160,000 | Capitol Abstract & Title Co | |
| Wright Kevin | $150,000 | None Available | |
| Abel, Tom Homes Inc | $210,000 | -- |
Source: Public Records
Mortgage History
| Date | Status | Borrower | Loan Amount |
|---|---|---|---|
| Previous Owner | Dunk Joseph | $145,250 | |
| Previous Owner | Dunk Joseph | $163,440 | |
| Previous Owner | Wright Kevin | $119,920 |
Source: Public Records
Tax History Compared to Growth
Tax History
| Year | Tax Paid | Tax Assessment Tax Assessment Total Assessment is a certain percentage of the fair market value that is determined by local assessors to be the total taxable value of land and additions on the property. | Land | Improvement |
|---|---|---|---|---|
| 2024 | -- | $24,082 | $3,941 | $20,141 |
| 2023 | $2,795 | $22,936 | $3,669 | $19,267 |
| 2022 | $2,702 | $21,843 | $3,884 | $17,959 |
| 2021 | $2,586 | $20,803 | $4,033 | $16,770 |
| 2020 | $2,463 | $19,813 | $3,000 | $16,813 |
| 2019 | $2,400 | $18,961 | $3,000 | $15,961 |
| 2018 | $2,401 | $18,962 | $3,000 | $15,962 |
| 2017 | $2,413 | $18,962 | $0 | $0 |
| 2016 | $2,430 | $18,962 | $3,000 | $15,962 |
| 2015 | $2,200 | $18,962 | $3,000 | $15,962 |
| 2014 | $2,145 | $18,067 | $2,520 | $15,547 |
Source: Public Records
Map
Nearby Homes
- 929 NE 28th St
- 1201 NE 26th St
- 1216 NE 24th St
- 904 NE 21st St
- 1025 NE 32nd St
- 1001 NE 34th Terrace
- 1428 NE 26th St
- 1300 NE 21st Place
- 700 NE 19th Terrace
- 1500 NE 33rd Terrace
- 1624 NE 32nd St
- 641 NE 16th St
- 2617 Ethan Ln
- 2300 Cowan Place
- 625 NE 15th St
- 2616 N Nail Pkwy
- 3505 Erie Dr
- 2512 Cowan Place
- 1109 E Hills Dr
- 2308 Fox Ave
- 917 NE 25th Ct
- 2517 Sequoyah Ave
- 2521 Sequoyah Ave
- 2601 Sequoyah Ave
- 908 NE 25th Ct
- 913 NE 25th Ct
- 1001 Northridge Rd
- 909 Northridge Rd
- 1000 NE 25th St
- 905 Northridge Rd
- 1005 Northridge Rd
- 2605 Sequoyah Ave
- 904 NE 25th Ct
- 1009 Northridge Rd
- 901 Truitt
- 1004 NE 25th St
- 2604 Jefferson Dr
- 1013 Northridge Rd
- 2609 Sequoyah Ave
- 2600 Sequoyah Ave